1223 E 35th St Savannah, GA 31404
Live Oak NeighborhoodEstimated Value: $205,423 - $232,000
2
Beds
1
Bath
748
Sq Ft
$290/Sq Ft
Est. Value
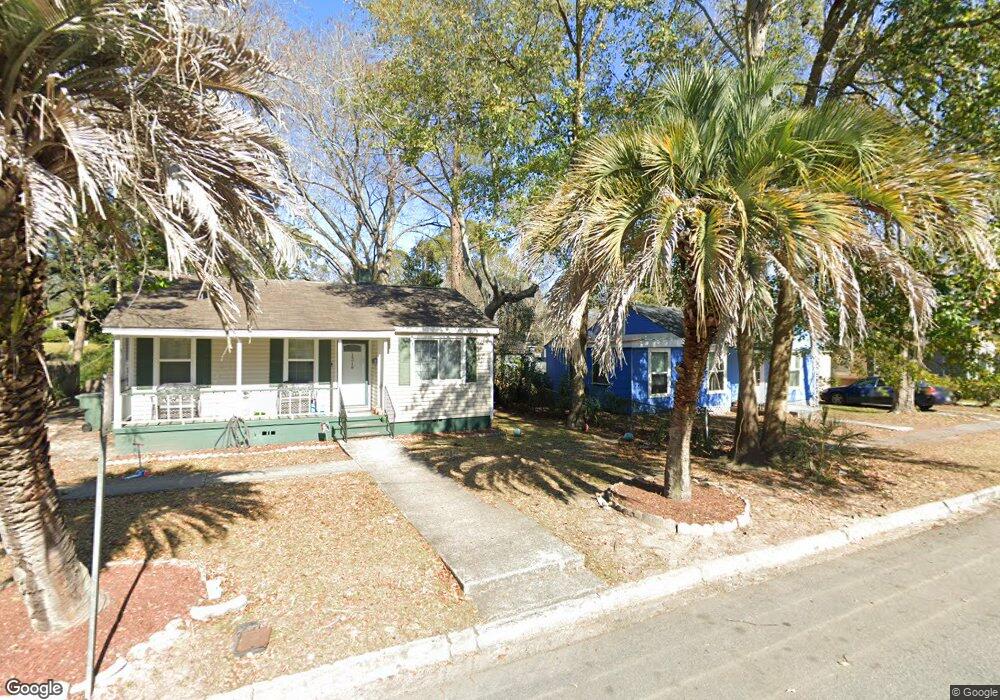
About This Home
This home is located at 1223 E 35th St, Savannah, GA 31404 and is currently estimated at $216,606, approximately $289 per square foot. 1223 E 35th St is a home located in Chatham County with nearby schools including Spencer Elementary School, Hubert Middle School, and Savannah Arts Academy.
Ownership History
Date
Name
Owned For
Owner Type
Purchase Details
Closed on
Jan 24, 2020
Sold by
Grassi Nick
Bought by
Grassi Properties Llc
Current Estimated Value
Purchase Details
Closed on
Apr 28, 2015
Sold by
Maner Frederick D
Bought by
Grassi Nick
Home Financials for this Owner
Home Financials are based on the most recent Mortgage that was taken out on this home.
Original Mortgage
$25,000
Interest Rate
3.8%
Mortgage Type
New Conventional
Purchase Details
Closed on
Jun 3, 2014
Sold by
Wilkinson Octavia Lamar
Bought by
Maner Frederick D
Purchase Details
Closed on
Mar 16, 2010
Sold by
Maner Frederick
Bought by
Wilkinson Octavia Lamar
Home Financials for this Owner
Home Financials are based on the most recent Mortgage that was taken out on this home.
Original Mortgage
$27,000
Interest Rate
4.91%
Mortgage Type
New Conventional
Purchase Details
Closed on
Sep 18, 2009
Sold by
Deutsche Bank National Tru
Bought by
Maner Frederick
Purchase Details
Closed on
Feb 3, 2009
Sold by
Cave Max Edward
Bought by
Deutsche Bank National Trust C
Create a Home Valuation Report for This Property
The Home Valuation Report is an in-depth analysis detailing your home's value as well as a comparison with similar homes in the area
Home Values in the Area
Average Home Value in this Area
Purchase History
| Date | Buyer | Sale Price | Title Company |
|---|---|---|---|
| Grassi Properties Llc | -- | -- | |
| Grassi Nick | $25,000 | -- | |
| Maner Frederick D | $26,862 | -- | |
| Wilkinson Octavia Lamar | $27,000 | -- | |
| Maner Frederick | $23,500 | -- | |
| Deutsche Bank National Trust C | $61,597 | -- |
Source: Public Records
Mortgage History
| Date | Status | Borrower | Loan Amount |
|---|---|---|---|
| Previous Owner | Grassi Nick | $25,000 | |
| Previous Owner | Wilkinson Octavia Lamar | $27,000 |
Source: Public Records
Tax History
| Year | Tax Paid | Tax Assessment Tax Assessment Total Assessment is a certain percentage of the fair market value that is determined by local assessors to be the total taxable value of land and additions on the property. | Land | Improvement |
|---|---|---|---|---|
| 2025 | $2,035 | $57,880 | $22,000 | $35,880 |
| 2024 | $2,035 | $56,160 | $22,000 | $34,160 |
| 2023 | $381 | $42,080 | $13,200 | $28,880 |
| 2022 | $764 | $32,640 | $13,200 | $19,440 |
| 2021 | $856 | $24,800 | $5,520 | $19,280 |
| 2020 | $596 | $18,400 | $5,520 | $12,880 |
| 2019 | $839 | $18,880 | $5,520 | $13,360 |
| 2018 | $752 | $16,720 | $5,520 | $11,200 |
| 2017 | $498 | $16,560 | $5,520 | $11,040 |
| 2016 | $292 | $10,000 | $4,420 | $5,580 |
| 2015 | $376 | $10,720 | $6,040 | $4,680 |
| 2014 | -- | $11,440 | $0 | $0 |
Source: Public Records
Map
Nearby Homes
- 1211 E 34th St
- 1207 E 34th St
- 1224 E 35th St
- 1203 E 34th St
- 1804 Cedar St
- 1222 NE 36th St
- 1221 E 31st St
- 1317 E 32nd St
- 1115 E 32nd St
- 1117 NE 36th St
- 1216 E 37th St
- 1228 E 31st St
- 1209 E Anderson St
- 1206 Seiler Ave
- 1309 E Anderson St
- 1401 NE 36th St
- 1230 E Anderson St
- 1228 E Anderson St Unit A & B
- 1407 E 32nd St
- 1010 E 31st St
- 1225 E 35th St
- 1217 E 35th St
- 1227 E 35th St
- 1220 E 35th St
- 1222 E 35th St
- 1230 NE 36th St
- 1226 E 35th St
- 1234 NE 36th St
- 1210 NE 36th St
- 1216 E 35th St
- 1209 E 35th St
- 1301 E 35th St
- 1206 NE 36th St
- 1219 NE 36th St
- 1221 NE 36th St
- 1217 NE 36th St
- 1803 Cedar St
- 1221 E 34th St
- 1219 E 34th St
- 1208 E 35th St
Your Personal Tour Guide
Ask me questions while you tour the home.