Estimated Value: $477,000 - $527,000
3
Beds
2
Baths
2,175
Sq Ft
$230/Sq Ft
Est. Value
About This Home
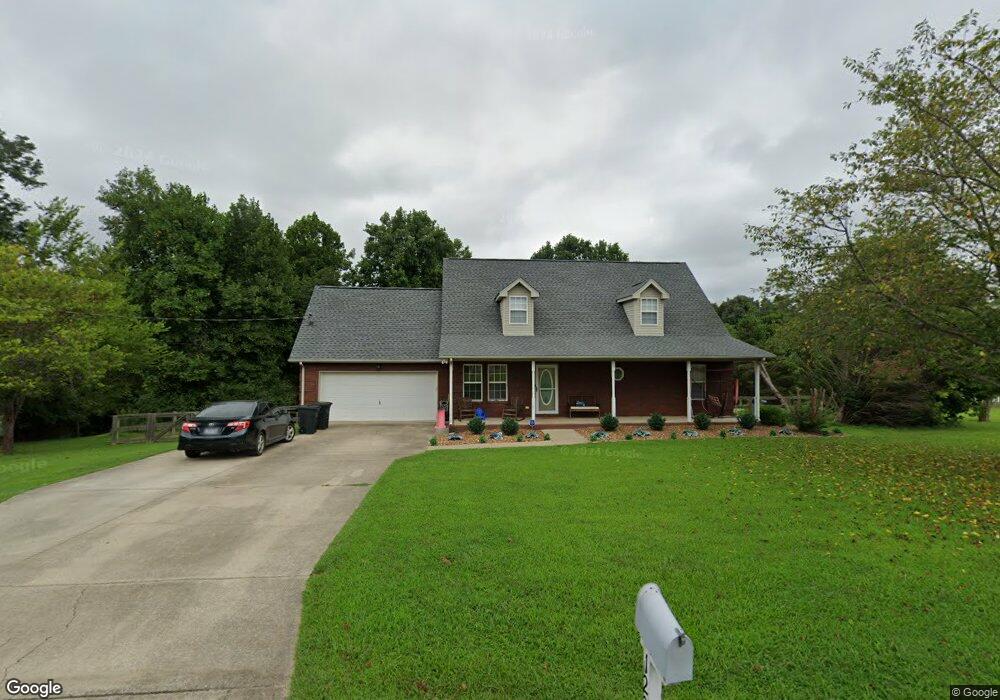
This home is located at 1223 Old Eastside Rd, Burns, TN 37029 and is currently estimated at $501,027, approximately $230 per square foot. 1223 Old Eastside Rd is a home located in Dickson County with nearby schools including Stuart Burns Elementary School, Burns Middle School, and Dickson County High School.
Ownership History
Date
Name
Owned For
Owner Type
Purchase Details
Closed on
Nov 20, 2018
Sold by
Davidson Brian S
Bought by
Lachance Matthew Christopher and Lachance Kayla
Current Estimated Value
Home Financials for this Owner
Home Financials are based on the most recent Mortgage that was taken out on this home.
Original Mortgage
$251,910
Outstanding Balance
$219,688
Interest Rate
4.8%
Mortgage Type
New Conventional
Estimated Equity
$281,339
Purchase Details
Closed on
May 23, 2014
Sold by
Casey Lisa
Bought by
Davidson Brian S and Davidson Brittany A
Home Financials for this Owner
Home Financials are based on the most recent Mortgage that was taken out on this home.
Original Mortgage
$195,918
Interest Rate
4.4%
Mortgage Type
New Conventional
Purchase Details
Closed on
Nov 9, 2000
Sold by
Duke George Thomas
Bought by
Casey Lisa
Home Financials for this Owner
Home Financials are based on the most recent Mortgage that was taken out on this home.
Original Mortgage
$131,750
Interest Rate
11.9%
Purchase Details
Closed on
Mar 11, 1999
Sold by
Huntland Properties South
Bought by
Duke George T
Create a Home Valuation Report for This Property
The Home Valuation Report is an in-depth analysis detailing your home's value as well as a comparison with similar homes in the area
Home Values in the Area
Average Home Value in this Area
Purchase History
| Date | Buyer | Sale Price | Title Company |
|---|---|---|---|
| Lachance Matthew Christopher | $279,900 | -- | |
| Davidson Brian S | $192,000 | -- | |
| Casey Lisa | $155,000 | -- | |
| Duke George T | -- | -- |
Source: Public Records
Mortgage History
| Date | Status | Borrower | Loan Amount |
|---|---|---|---|
| Open | Lachance Matthew Christopher | $251,910 | |
| Previous Owner | Davidson Brian S | $195,918 | |
| Previous Owner | Duke George T | $131,750 |
Source: Public Records
Tax History Compared to Growth
Tax History
| Year | Tax Paid | Tax Assessment Tax Assessment Total Assessment is a certain percentage of the fair market value that is determined by local assessors to be the total taxable value of land and additions on the property. | Land | Improvement |
|---|---|---|---|---|
| 2024 | $1,497 | $88,575 | $13,750 | $74,825 |
| 2023 | $1,523 | $64,825 | $10,125 | $54,700 |
| 2022 | $1,523 | $64,825 | $10,125 | $54,700 |
| 2021 | $1,523 | $64,825 | $10,125 | $54,700 |
| 2020 | $1,523 | $64,825 | $10,125 | $54,700 |
| 2019 | $1,523 | $64,825 | $10,125 | $54,700 |
| 2018 | $1,405 | $52,050 | $7,500 | $44,550 |
| 2017 | $1,405 | $52,050 | $7,500 | $44,550 |
| 2016 | $1,405 | $52,050 | $7,500 | $44,550 |
| 2015 | $1,297 | $44,725 | $7,500 | $37,225 |
| 2014 | $1,297 | $44,725 | $7,500 | $37,225 |
Source: Public Records
Map
Nearby Homes
- 545 Red Fox Dr
- 120 Old Highway 96
- 9 Sycamore Ridge W
- 610 Dogwood Ln
- 1348 Camp Ravine Rd
- 4095 Highway 96
- 0 Camp Ravine Rd
- 200 Eastside Rd
- 1168 Johnny Hall Rd
- 201 Tamyra Ct
- 1000 Bradby Dr
- 1004 Bradby Dr
- 1034 Ridglea Dr
- 1501 Spencer Mill Rd
- 115 Brown Cemetery Rd
- 0 Spencer Mill Rd Unit RTC2945261
- 1527 White Bluff Rd
- 1995 Spencer Mill Rd
- 304 Cherokee Ct
- 1550 Tennessee 96
- 1223 Old East Side Rd
- 1223 1223 Old Eastside Rd
- 1217 Old East Side Rd
- 1217 Old East Side Rd Unit Rd
- 1229 Old East Side Rd
- 216 Highland Ln
- 1235 Old East Side Rd
- 1211 Old East Side Rd
- 218 Highland Ln
- 1212 Old East Side Rd
- 1212 Old East Side Rd Unit Rd
- 1212 Old Eastside Rd
- 1206 Old East Side Rd
- 1222 Old E
- 214 Highland Ln
- 34 Highland Ln
- 1202 Old Eastside Rd
- 1207 Old East Side Rd
- 1239 Old East Side Rd
- 1202 Old East Side Rd