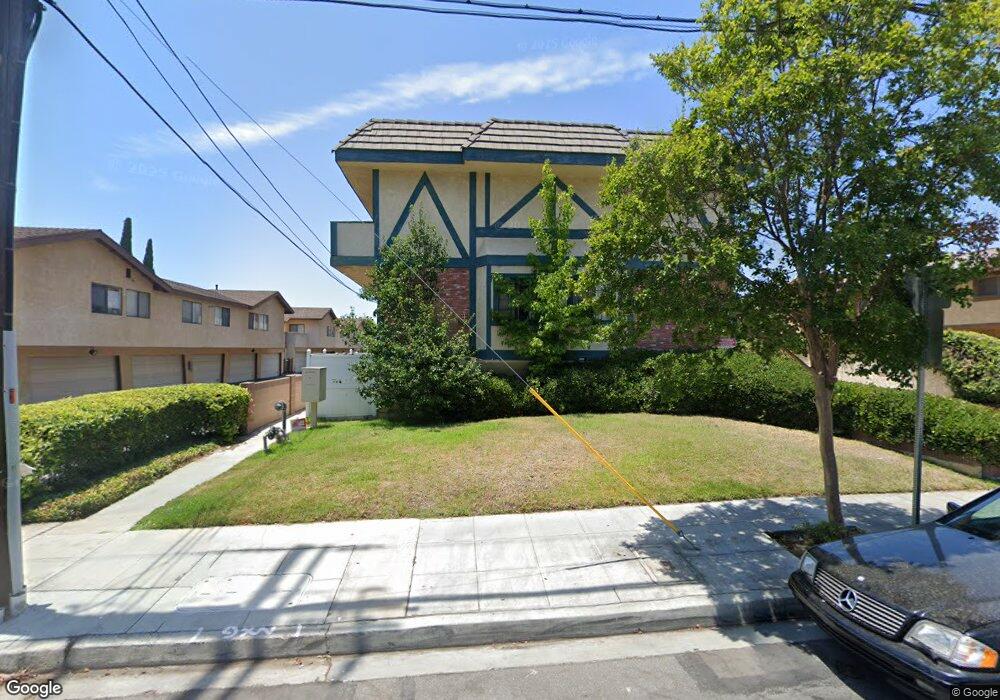
1223 S Golden West Ave Unit F Arcadia, CA 91007
Estimated Value: $694,000 - $723,000
2
Beds
3
Baths
1,179
Sq Ft
$598/Sq Ft
Est. Value
About This Home
This home is located at 1223 S Golden West Ave Unit F, Arcadia, CA 91007 and is currently estimated at $705,492, approximately $598 per square foot. 1223 S Golden West Ave Unit F is a home located in Los Angeles County with nearby schools including Longden Elementary School, Oak Avenue Intermediate School, and Temple City High School.
Ownership History
Date
Name
Owned For
Owner Type
Purchase Details
Closed on
Aug 11, 2025
Sold by
Huang Shu Hwa and Huang Ho Shu
Bought by
Lin Kenny Hy and Lin Josephine Sh
Current Estimated Value
Purchase Details
Closed on
Mar 1, 2016
Sold by
Chan Kimberly Yu Fen
Bought by
Huang Ho Shu Hwa
Home Financials for this Owner
Home Financials are based on the most recent Mortgage that was taken out on this home.
Original Mortgage
$366,400
Interest Rate
3.81%
Mortgage Type
New Conventional
Purchase Details
Closed on
Aug 13, 1998
Sold by
Yang Lawrence
Bought by
Chan Kimberly Yu Fen
Home Financials for this Owner
Home Financials are based on the most recent Mortgage that was taken out on this home.
Original Mortgage
$113,760
Interest Rate
6.5%
Create a Home Valuation Report for This Property
The Home Valuation Report is an in-depth analysis detailing your home's value as well as a comparison with similar homes in the area
Home Values in the Area
Average Home Value in this Area
Purchase History
| Date | Buyer | Sale Price | Title Company |
|---|---|---|---|
| Lin Kenny Hy | $700,000 | Fidelity National Title | |
| Huang Ho Shu Hwa | $458,000 | Fatcola | |
| Chan Kimberly Yu Fen | $142,500 | Stewart Title |
Source: Public Records
Mortgage History
| Date | Status | Borrower | Loan Amount |
|---|---|---|---|
| Previous Owner | Huang Ho Shu Hwa | $366,400 | |
| Previous Owner | Chan Kimberly Yu Fen | $113,760 |
Source: Public Records
Tax History Compared to Growth
Tax History
| Year | Tax Paid | Tax Assessment Tax Assessment Total Assessment is a certain percentage of the fair market value that is determined by local assessors to be the total taxable value of land and additions on the property. | Land | Improvement |
|---|---|---|---|---|
| 2025 | $6,371 | $542,171 | $338,800 | $203,371 |
| 2024 | $6,371 | $531,541 | $332,157 | $199,384 |
| 2023 | $6,231 | $521,120 | $325,645 | $195,475 |
| 2022 | $5,821 | $510,903 | $319,260 | $191,643 |
| 2021 | $5,935 | $500,886 | $313,000 | $187,886 |
| 2019 | $5,721 | $486,031 | $303,717 | $182,314 |
| 2018 | $5,599 | $476,502 | $297,762 | $178,740 |
| 2016 | $2,270 | $188,303 | $59,189 | $129,114 |
| 2015 | $2,230 | $185,475 | $58,300 | $127,175 |
| 2014 | $2,204 | $181,842 | $57,158 | $124,684 |
Source: Public Records
Map
Nearby Homes
- 1004 W Duarte Rd Unit 6
- 905 W Duarte Rd Unit A
- 833 W Duarte Rd
- 1214 Temple City Blvd Unit 8
- 1222 Temple City Blvd
- 825 W Duarte Rd Unit E
- 1228 Temple City Blvd
- 9618 E Camino Real Ave
- 914 Fairview Ave Unit 15
- 1161 W Duarte Rd Unit 3
- 1522 S Baldwin Ave Unit 15
- 905 Sunset Blvd Unit B
- 9861 E Lemon Ave
- 6770 Oak Ave
- 903 Sunset Blvd Unit B
- 903 Sunset Blvd Unit A
- 6839 Oak Ave
- 631 W Camino Real Ave
- 662 W Norman Ave
- 1107 Okoboji Dr
- 1223 S Golden West Ave Unit B
- 1223 S Golden West Ave Unit A
- 1223 S Golden West Ave Unit H
- 1223 S Golden West Ave Unit G
- 1223 S Golden West Ave Unit E
- 1223 S Golden West Ave Unit D
- 1223 S Golden West Ave Unit C
- 1223 S Golden Ave W Unit D
- 1223 S Golden Ave W Unit A
- 1223 S Golden Ave W Unit B
- 1223 S Golden Ave W Unit H
- 1219 S Golden Ave W Unit 3
- 1219 S Golden Ave W Unit 6
- 1219 S Golden Ave W Unit 4
- 1219 S Golden Ave W Unit 2
- 1219 S Golden West Ave Unit 6
- 1219 S Golden West Ave Unit 5
- 1219 S Golden West Ave Unit 4
- 1219 S Golden West Ave Unit 3
- 1219 S Golden West Ave Unit 2