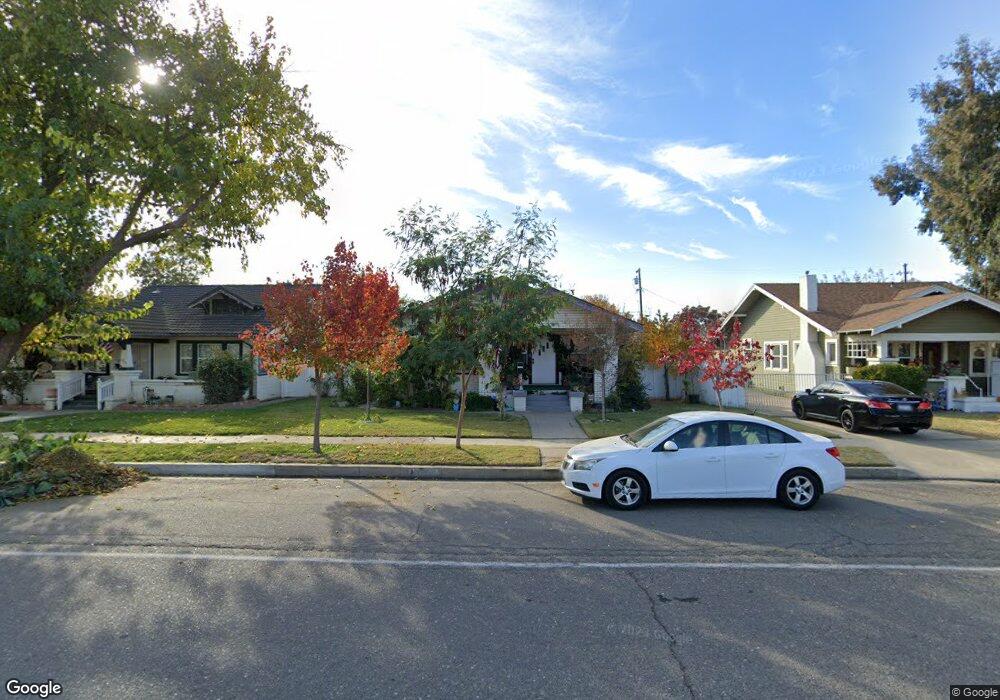
1223 S St Newman, CA 95360
Estimated Value: $291,000 - $412,000
2
Beds
3
Baths
1,405
Sq Ft
$247/Sq Ft
Est. Value
About This Home
This home is located at 1223 S St, Newman, CA 95360 and is currently estimated at $346,364, approximately $246 per square foot. 1223 S St is a home located in Stanislaus County with nearby schools including Orestimba High School.
Ownership History
Date
Name
Owned For
Owner Type
Purchase Details
Closed on
Aug 9, 2022
Sold by
Sam Deleon
Bought by
Sam De Leon 2022 Trust
Current Estimated Value
Purchase Details
Closed on
May 18, 1995
Sold by
American General Finance Inc
Bought by
Deleon Sam
Home Financials for this Owner
Home Financials are based on the most recent Mortgage that was taken out on this home.
Original Mortgage
$81,391
Interest Rate
8.37%
Mortgage Type
FHA
Purchase Details
Closed on
Oct 14, 1994
Sold by
American General Finance Inc
Bought by
American General Finance Inc
Purchase Details
Closed on
Feb 17, 1994
Sold by
First Capital Loan Services
Bought by
Silverfir Ltd L P
Create a Home Valuation Report for This Property
The Home Valuation Report is an in-depth analysis detailing your home's value as well as a comparison with similar homes in the area
Home Values in the Area
Average Home Value in this Area
Purchase History
| Date | Buyer | Sale Price | Title Company |
|---|---|---|---|
| Sam De Leon 2022 Trust | -- | None Listed On Document | |
| Deleon Sam | $82,000 | Stewart Title | |
| American General Finance Inc | $14,243 | First American Title Co | |
| Silverfir Ltd L P | $28,822 | -- |
Source: Public Records
Mortgage History
| Date | Status | Borrower | Loan Amount |
|---|---|---|---|
| Previous Owner | Deleon Sam | $81,391 |
Source: Public Records
Tax History
| Year | Tax Paid | Tax Assessment Tax Assessment Total Assessment is a certain percentage of the fair market value that is determined by local assessors to be the total taxable value of land and additions on the property. | Land | Improvement |
|---|---|---|---|---|
| 2025 | $1,556 | $137,718 | $50,382 | $87,336 |
| 2024 | $1,516 | $135,019 | $49,395 | $85,624 |
| 2023 | $1,473 | $132,373 | $48,427 | $83,946 |
| 2022 | $1,449 | $129,778 | $47,478 | $82,300 |
| 2021 | $1,426 | $127,235 | $46,548 | $80,687 |
| 2020 | $1,397 | $125,931 | $46,071 | $79,860 |
| 2019 | $1,402 | $123,463 | $45,168 | $78,295 |
| 2018 | $1,309 | $121,043 | $44,283 | $76,760 |
| 2017 | $1,423 | $118,670 | $43,415 | $75,255 |
| 2016 | $1,260 | $116,344 | $42,564 | $73,780 |
| 2015 | $1,299 | $114,597 | $41,925 | $72,672 |
| 2014 | $1,224 | $107,000 | $20,000 | $87,000 |
Source: Public Records
Map
Nearby Homes
Your Personal Tour Guide
Ask me questions while you tour the home.