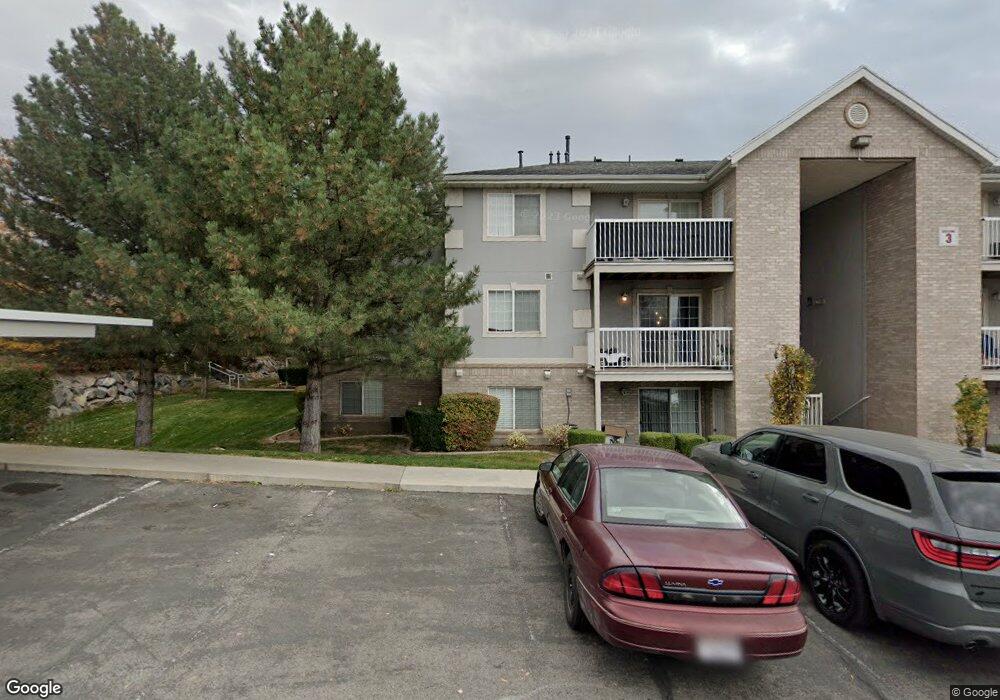
1223 W 1520 N Orem, UT 84057
Aspen NeighborhoodEstimated Value: $259,000 - $278,000
2
Beds
1
Bath
878
Sq Ft
$309/Sq Ft
Est. Value
About This Home
This home is located at 1223 W 1520 N, Orem, UT 84057 and is currently estimated at $271,647, approximately $309 per square foot. 1223 W 1520 N is a home located in Utah County with nearby schools including Bonneville Elementary School, Orem Junior High School, and Timpanogos High School.
Ownership History
Date
Name
Owned For
Owner Type
Purchase Details
Closed on
Nov 24, 2003
Sold by
Love Barrett Morrell
Bought by
Mitchell Kelley J
Current Estimated Value
Home Financials for this Owner
Home Financials are based on the most recent Mortgage that was taken out on this home.
Original Mortgage
$93,100
Outstanding Balance
$39,385
Interest Rate
4.75%
Mortgage Type
Purchase Money Mortgage
Estimated Equity
$232,262
Purchase Details
Closed on
Jun 11, 2001
Sold by
Olsen Williams Ross M and Olsen Williams Emily
Bought by
Love Barrett Morrell
Home Financials for this Owner
Home Financials are based on the most recent Mortgage that was taken out on this home.
Original Mortgage
$91,563
Interest Rate
7.14%
Purchase Details
Closed on
Jan 21, 1998
Sold by
Tmm Associates L C
Bought by
Olsen Williams Ross M and Olsen Williams Emily
Home Financials for this Owner
Home Financials are based on the most recent Mortgage that was taken out on this home.
Original Mortgage
$84,750
Interest Rate
7.13%
Mortgage Type
FHA
Create a Home Valuation Report for This Property
The Home Valuation Report is an in-depth analysis detailing your home's value as well as a comparison with similar homes in the area
Home Values in the Area
Average Home Value in this Area
Purchase History
| Date | Buyer | Sale Price | Title Company |
|---|---|---|---|
| Mitchell Kelley J | -- | Equity Title Agency Inc | |
| Love Barrett Morrell | -- | Associated Title Company | |
| Olsen Williams Ross M | -- | First American |
Source: Public Records
Mortgage History
| Date | Status | Borrower | Loan Amount |
|---|---|---|---|
| Open | Mitchell Kelley J | $93,100 | |
| Previous Owner | Love Barrett Morrell | $91,563 | |
| Previous Owner | Olsen Williams Ross M | $84,750 | |
| Closed | Love Barrett Morrell | $3,720 |
Source: Public Records
Tax History Compared to Growth
Tax History
| Year | Tax Paid | Tax Assessment Tax Assessment Total Assessment is a certain percentage of the fair market value that is determined by local assessors to be the total taxable value of land and additions on the property. | Land | Improvement |
|---|---|---|---|---|
| 2025 | $1,083 | $136,565 | $27,600 | $220,700 |
| 2024 | $1,083 | $132,440 | $0 | $0 |
| 2023 | $1,068 | $140,305 | $0 | $0 |
| 2022 | $1,049 | $133,540 | $0 | $0 |
| 2021 | $987 | $190,400 | $22,800 | $167,600 |
| 2020 | $897 | $170,000 | $20,400 | $149,600 |
| 2019 | $830 | $163,500 | $21,300 | $142,200 |
| 2018 | $797 | $150,000 | $18,000 | $132,000 |
| 2017 | $690 | $69,575 | $0 | $0 |
| 2016 | $680 | $63,250 | $0 | $0 |
| 2015 | $688 | $60,500 | $0 | $0 |
| 2014 | $666 | $58,300 | $0 | $0 |
Source: Public Records
Map
Nearby Homes
- 1499 N 1200 W Unit 8
- 1503 N 1285 W
- 1554 N 1150 W
- 1336 N 1230 W
- 1154 W 1340 N
- 1645 W 1600 N
- 1798 N 860 W
- 856 W 1840 N
- 1561 N 740 W
- 999 W 1100 N
- 1062 N 1035 W
- 983 W 1055 N Unit 816
- 1030 N 995 W Unit 915
- 1030 N 995 W Unit 905
- 1081 W 993 N Unit 101
- 1018 N 985 W Unit 516
- 1140 W 950 N Unit D304
- 1140 W 950 N Unit B402
- 1140 W 950 N Unit A401
- 1991 N 920 W
- 1225 W 1520 N
- 1221 W 1520 N
- 1221 W 1520 N Unit 27
- 1225 W 1520 N Unit 35
- 1229 W 1520 N
- 1227 W 1520 N
- 1231 W 1520 N
- 1235 W 1520 N
- 1237 W 1520 N
- 1233 W 1520 N
- 1243 W 1520 N
- 1241 W 1520 N
- 1239 W 1520 N
- 1513 N 1200 W
- 1511 N 1200 W
- 1509 N 1200 W
- 1513 N 1200 W Unit 10
- 1511 N 1200 W Unit 7
- 1511 N 1200 W Unit 6
- 1509 N 1200 W Unit 2