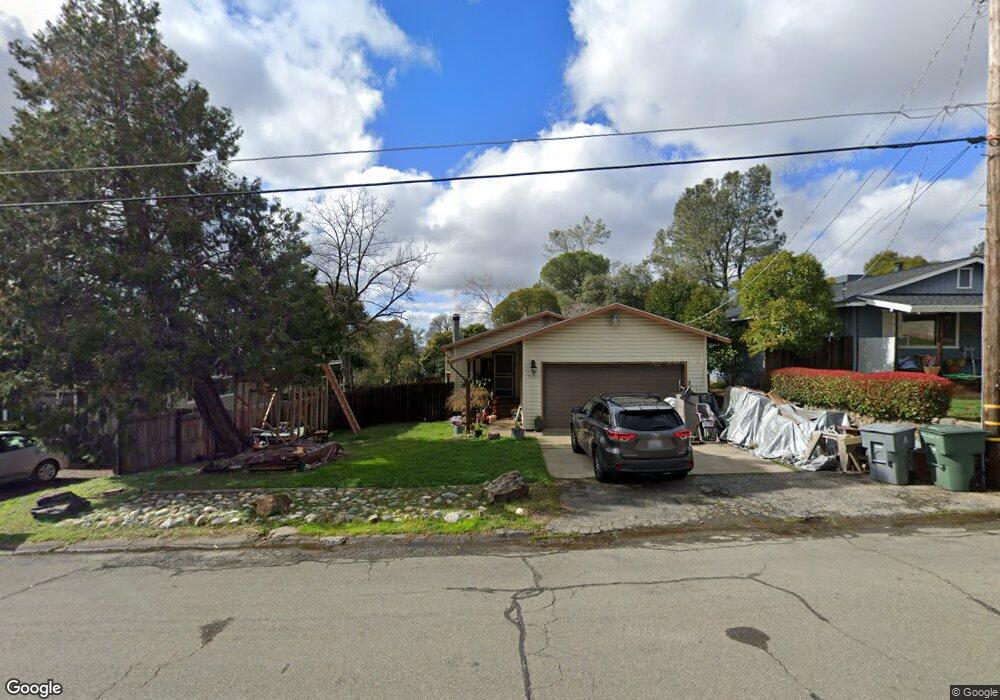
1223 Wesley Ln Auburn, CA 95603
Country Club Estates NeighborhoodEstimated Value: $475,000 - $496,000
3
Beds
2
Baths
1,344
Sq Ft
$360/Sq Ft
Est. Value
About This Home
This home is located at 1223 Wesley Ln, Auburn, CA 95603 and is currently estimated at $483,491, approximately $359 per square foot. 1223 Wesley Ln is a home located in Placer County with nearby schools including Auburn Elementary School, Placer High School, and Bowman Charter School.
Ownership History
Date
Name
Owned For
Owner Type
Purchase Details
Closed on
Jun 9, 2021
Sold by
Barrera Stancliff Cynthia
Bought by
Barrera Frank and Rouse Sherrie Renee
Current Estimated Value
Home Financials for this Owner
Home Financials are based on the most recent Mortgage that was taken out on this home.
Original Mortgage
$397,700
Outstanding Balance
$360,068
Interest Rate
2.9%
Mortgage Type
New Conventional
Estimated Equity
$123,423
Purchase Details
Closed on
Dec 6, 2006
Sold by
Barrera Stancliff Cynthia
Bought by
Barrera Stancliff Cynthia
Purchase Details
Closed on
Jun 5, 1995
Sold by
Barrera Stancliff Cynthia and Stancliff Theodore L
Bought by
Barrera Stancliff Cynthia
Purchase Details
Closed on
Feb 22, 1994
Sold by
Brewer Gloria Gayle
Bought by
Staancliff Theodore L and Barrera Stancliff Cynthia
Home Financials for this Owner
Home Financials are based on the most recent Mortgage that was taken out on this home.
Original Mortgage
$104,000
Interest Rate
6.98%
Mortgage Type
Purchase Money Mortgage
Create a Home Valuation Report for This Property
The Home Valuation Report is an in-depth analysis detailing your home's value as well as a comparison with similar homes in the area
Home Values in the Area
Average Home Value in this Area
Purchase History
| Date | Buyer | Sale Price | Title Company |
|---|---|---|---|
| Barrera Frank | $410,000 | Stewart Title Of Sacramento | |
| Barrera Stancliff Cynthia | -- | First American Title Company | |
| Barrera Stancliff Cynthia | -- | -- | |
| Staancliff Theodore L | $130,000 | Sierra Valley Title Co |
Source: Public Records
Mortgage History
| Date | Status | Borrower | Loan Amount |
|---|---|---|---|
| Open | Barrera Frank | $397,700 | |
| Previous Owner | Staancliff Theodore L | $104,000 |
Source: Public Records
Tax History
| Year | Tax Paid | Tax Assessment Tax Assessment Total Assessment is a certain percentage of the fair market value that is determined by local assessors to be the total taxable value of land and additions on the property. | Land | Improvement |
|---|---|---|---|---|
| 2025 | $5,570 | $425,000 | $134,800 | $290,200 |
| 2023 | $5,570 | $414,000 | $131,300 | $282,700 |
| 2022 | $5,646 | $418,200 | $132,600 | $285,600 |
| 2021 | $3,311 | $204,106 | $86,353 | $117,753 |
| 2020 | $3,295 | $202,014 | $85,468 | $116,546 |
| 2019 | $3,255 | $198,054 | $83,793 | $114,261 |
| 2018 | $3,142 | $194,171 | $82,150 | $112,021 |
| 2017 | $3,106 | $190,365 | $80,540 | $109,825 |
| 2016 | $3,065 | $186,633 | $78,961 | $107,672 |
| 2015 | $3,018 | $183,830 | $77,775 | $106,055 |
| 2014 | $2,989 | $180,230 | $76,252 | $103,978 |
Source: Public Records
Map
Nearby Homes
- 1333 Wesley Ln
- 12102 Hemlock Dr
- 1045 Fox Run Ct
- 12366 Pepperwood Cir Unit 182
- 1622 Spruce Ct
- 12339 Pepperwood Cir Unit 12339
- 12318 Pepperwood Cir Unit 228
- 12300 Pepperwood Cir
- 1638 Alder Cir Unit 1638
- 1406 Grass Valley Hwy
- 12411 Homestead Way
- 12340 Erin Dr
- 12125 Holly Vista Way
- 1732 Tracy Ln
- 12439 Homestead Way
- 12280 Westwood Dr
- 1605 Grass Valley Hwy Unit 62
- 1605 Grass Valley Hwy
- 1605 Grass Valley Hwy Unit 54
- 1605 Grass Valley Hwy Unit 92
- 1243 Wesley Ln
- 1211 Wesley Ln
- 12335 Luther Rd
- 1244 Harmony Ln
- 1263 Wesley Ln
- 1240 Harmony Ln
- 12331 Luther Rd
- 1260 Harmony Ln
- 12327 Luther Rd
- 1272 Harmony Ln
- 1287 Wesley Ln
- 1280 Wesley Ln
- 1191 Star Ln
- 1197 Wesley Ln
- 1280 Harmony Ln
- 1194 Wesley Ln
- 1521 Cottonwood Cir
- 1529 Cottonwood Cir Unit 29
- 1545 Cottonwood Cir Unit 20
Your Personal Tour Guide
Ask me questions while you tour the home.