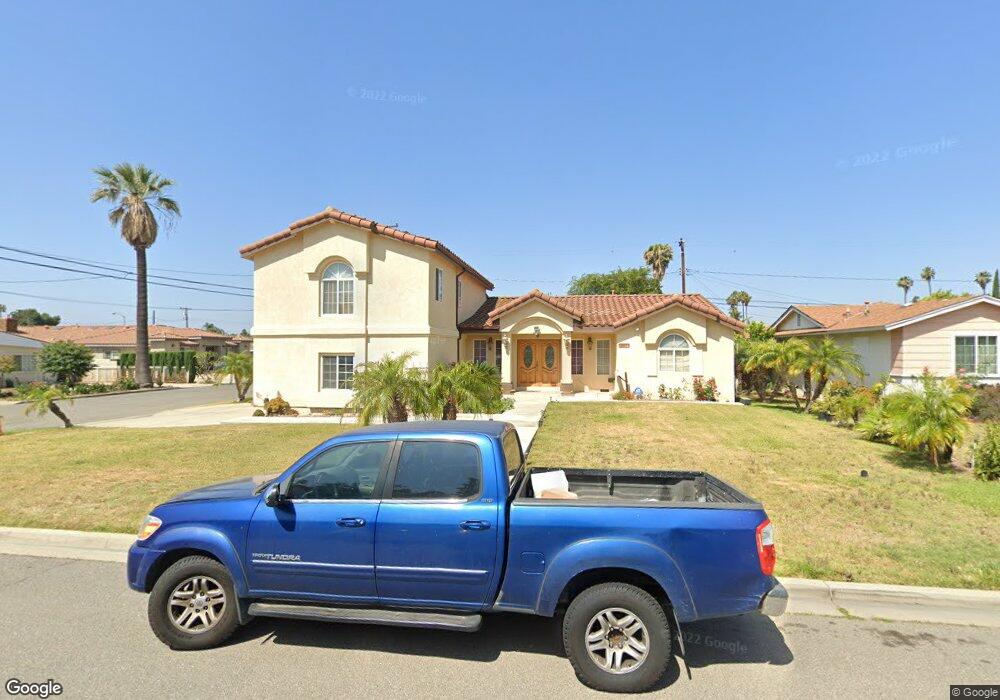
12231 Hackamore Rd Garden Grove, CA 92840
Estimated Value: $1,238,000 - $1,331,000
4
Beds
3
Baths
2,745
Sq Ft
$475/Sq Ft
Est. Value
About This Home
This home is located at 12231 Hackamore Rd, Garden Grove, CA 92840 and is currently estimated at $1,302,765, approximately $474 per square foot. 12231 Hackamore Rd is a home located in Orange County with nearby schools including Ethel M. Evans Elementary School, Garden Grove High School, and St. Columban School.
Ownership History
Date
Name
Owned For
Owner Type
Purchase Details
Closed on
Jun 1, 2016
Sold by
Dao Cathrine T
Bought by
Dao Cathrine T
Current Estimated Value
Home Financials for this Owner
Home Financials are based on the most recent Mortgage that was taken out on this home.
Original Mortgage
$416,000
Outstanding Balance
$186,153
Interest Rate
3.57%
Mortgage Type
New Conventional
Estimated Equity
$1,116,612
Purchase Details
Closed on
Nov 29, 2001
Sold by
Mcbride Daliah L
Bought by
Dao Cathrine Tu
Home Financials for this Owner
Home Financials are based on the most recent Mortgage that was taken out on this home.
Original Mortgage
$328,000
Interest Rate
7.17%
Purchase Details
Closed on
Feb 5, 1994
Sold by
Post William E
Bought by
Mcbride Daliah L
Create a Home Valuation Report for This Property
The Home Valuation Report is an in-depth analysis detailing your home's value as well as a comparison with similar homes in the area
Purchase History
| Date | Buyer | Sale Price | Title Company |
|---|---|---|---|
| Dao Cathrine T | -- | Fidelity National Title Co | |
| Dao Cathrine T | -- | Fidelity National Title Co | |
| Dao Cathrine Tu | $410,000 | Lawyers Title Company | |
| Mcbride Daliah L | -- | -- |
Source: Public Records
Mortgage History
| Date | Status | Borrower | Loan Amount |
|---|---|---|---|
| Open | Dao Cathrine T | $416,000 | |
| Previous Owner | Dao Cathrine Tu | $328,000 |
Source: Public Records
Tax History
| Year | Tax Paid | Tax Assessment Tax Assessment Total Assessment is a certain percentage of the fair market value that is determined by local assessors to be the total taxable value of land and additions on the property. | Land | Improvement |
|---|---|---|---|---|
| 2025 | $7,421 | $605,685 | $324,084 | $281,601 |
| 2024 | $7,421 | $593,809 | $317,729 | $276,080 |
| 2023 | $7,286 | $582,166 | $311,499 | $270,667 |
| 2022 | $7,132 | $570,751 | $305,391 | $265,360 |
| 2021 | $7,057 | $559,560 | $299,403 | $260,157 |
| 2020 | $6,963 | $553,823 | $296,333 | $257,490 |
| 2019 | $6,828 | $542,964 | $290,522 | $252,442 |
| 2018 | $6,692 | $532,318 | $284,825 | $247,493 |
| 2017 | $6,600 | $521,881 | $279,240 | $242,641 |
| 2016 | $6,270 | $511,649 | $273,765 | $237,884 |
| 2015 | $6,183 | $503,964 | $269,653 | $234,311 |
| 2014 | $6,033 | $494,093 | $264,371 | $229,722 |
Source: Public Records
Map
Nearby Homes
- 12061 Nutwood St
- 12571 Kensington Ln
- 10065 Hidden Village Rd
- 10520 Lakeside Dr N Unit L
- 10531 Lakeside Dr S Unit J
- 10641 Lakeside Dr S Unit 249
- 10551 Lakeside Dr S
- 11721 Palmwood Dr
- 10701 Lauren Cir
- 12256 Lesley St
- 10941 Allen Dr
- 11701 Faye Ave
- 10221 Roselee Dr
- 10322 Park Ave
- 11662 Stephanie Ln
- 12555 Euclid St Unit 34
- 12332 Euclid St
- 10092 Roselee Dr
- 12635 Main St Unit 201
- 10361 Garden Grove Blvd Unit 50
- 12211 Hackamore Rd
- 12232 Faye Ave
- 12212 Faye Ave
- 12201 Hackamore Rd
- 12232 Hackamore Rd
- 12202 Faye Ave
- 12212 Hackamore Rd
- 10402 Allen Dr
- 10412 Allen Dr
- 10392 Allen Dr
- 12202 Hackamore Rd
- 10432 Allen Dr
- 12181 Hackamore Rd
- 10382 Allen Dr
- 12182 Faye Ave
- 10372 Allen Dr
- 10442 Allen Dr
- 12192 Hackamore Rd
- 12231 Faye Ave
- 12211 Faye Ave
Your Personal Tour Guide
Ask me questions while you tour the home.