


PENDING
$5K PRICE DROP
Estimated payment $1,273/month
Total Views
5,322
5
Beds
2
Baths
2,100
Sq Ft
$98
Price per Sq Ft
Highlights
- 1 Fireplace
- 1.5 Car Attached Garage
- Forced Air Heating and Cooling System
- Front Porch
- Shed
- 1-Story Property
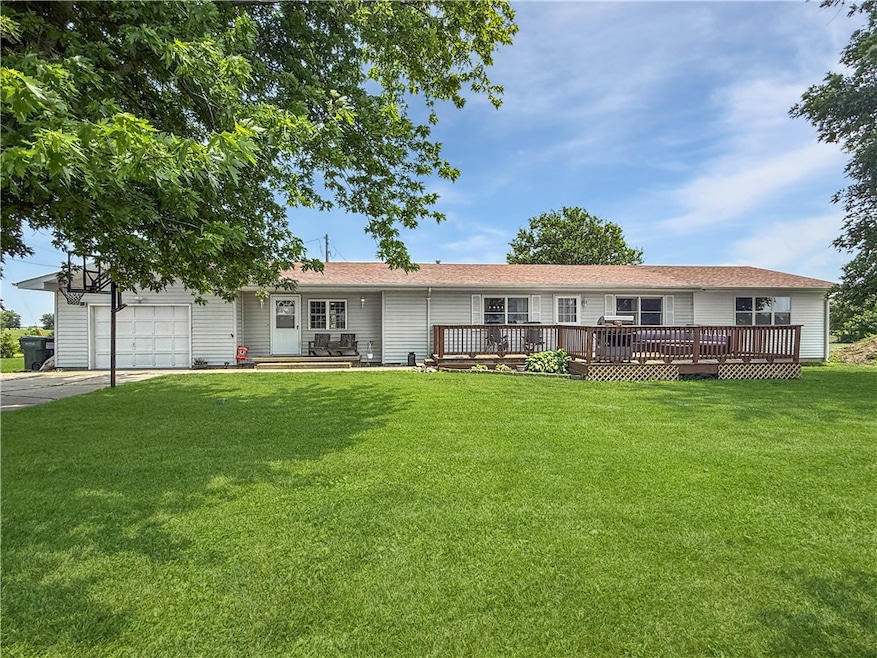
About This Home
Enjoy the best of both worlds with this beautifully updated one-level home, nestled on over an acre just outside of town. Offering five generously sized bedrooms and two full bathrooms, this spacious property has been thoughtfully updated—highlighted by a brand-new addition completed less than a month ago. Once inside, you’ll find a fully remodeled eat-in kitchen complete with modern appliances, bar seating, and ample space for gathering. The adjacent living room features a cozy electric fireplace and glass doors leading to a back deck, ideal for relaxing or entertaining. The primary bedroom is located just off the living room for added privacy, while a separate hallway leads to four more bedrooms and a bright, spacious second living area filled with natural light—perfect for a playroom, home office, or additional lounge space. Outdoors, enjoy an oversized 1- car attached garage, storage shed, trees, fire pit, and a large side yard ready for your outdoor hobbies or gardening dreams.
Home Details
Home Type
- Single Family
Est. Annual Taxes
- $1,899
Year Built
- Built in 1954
Lot Details
- 1.2 Acre Lot
Parking
- 1.5 Car Attached Garage
Home Design
- Shingle Roof
- Vinyl Siding
Interior Spaces
- 2,100 Sq Ft Home
- 1-Story Property
- 1 Fireplace
- Crawl Space
Kitchen
- Range with Range Hood
- Dishwasher
Bedrooms and Bathrooms
- 5 Bedrooms
- 2 Full Bathrooms
Laundry
- Laundry on main level
- Dryer
- Washer
Outdoor Features
- Shed
- Front Porch
Utilities
- Forced Air Heating and Cooling System
- Heating System Uses Propane
- Propane Water Heater
- Septic Tank
Listing and Financial Details
- Assessor Parcel Number 03-11-08-00-300-009
Map
Create a Home Valuation Report for This Property
The Home Valuation Report is an in-depth analysis detailing your home's value as well as a comparison with similar homes in the area
Home Values in the Area
Average Home Value in this Area
Tax History
| Year | Tax Paid | Tax Assessment Tax Assessment Total Assessment is a certain percentage of the fair market value that is determined by local assessors to be the total taxable value of land and additions on the property. | Land | Improvement |
|---|---|---|---|---|
| 2024 | $2,004 | $33,852 | $3,707 | $30,145 |
| 2023 | $1,899 | $33,852 | $3,707 | $30,145 |
| 2022 | $1,881 | $30,225 | $3,310 | $26,915 |
| 2021 | $1,890 | $30,225 | $3,310 | $26,915 |
| 2020 | $1,505 | $24,431 | $2,483 | $21,948 |
| 2019 | $1,505 | $24,431 | $2,483 | $21,948 |
| 2018 | $1,528 | $24,431 | $2,483 | $21,948 |
| 2017 | $1,559 | $24,985 | $2,539 | $22,446 |
| 2016 | $1,343 | $21,155 | $2,070 | $19,085 |
| 2015 | $1,282 | $21,735 | $2,127 | $19,608 |
| 2014 | $855 | $21,155 | $2,070 | $19,085 |
| 2013 | $855 | $20,440 | $2,000 | $18,440 |
Source: Public Records
Property History
| Date | Event | Price | Change | Sq Ft Price |
|---|---|---|---|---|
| 07/27/2025 07/27/25 | Pending | -- | -- | -- |
| 07/13/2025 07/13/25 | Price Changed | $205,000 | -2.4% | $98 / Sq Ft |
| 06/11/2025 06/11/25 | For Sale | $210,000 | -- | $100 / Sq Ft |
Source: Central Illinois Board of REALTORS®
Purchase History
| Date | Type | Sale Price | Title Company |
|---|---|---|---|
| Warranty Deed | $88,500 | Attorney | |
| Warranty Deed | $65,666 | Attorney | |
| Deed | $21,200 | -- |
Source: Public Records
Mortgage History
| Date | Status | Loan Amount | Loan Type |
|---|---|---|---|
| Open | $57,260 | New Conventional | |
| Closed | $20,000 | Credit Line Revolving | |
| Closed | $70,800 | New Conventional | |
| Previous Owner | $52,200 | Commercial | |
| Previous Owner | $42,000 | Commercial |
Source: Public Records
Similar Homes in Casey, IL
Source: Central Illinois Board of REALTORS®
MLS Number: 6252486
APN: 03-11-08-00-300-009
Nearby Homes
- 0 Northwood Ln
- 515 Horseshoe Ln
- 0 Highway 40 W
- 509 NE 2nd St
- 0 Illinois 49
- 902 E Alabama Ave
- 106 E Adams Ave
- 408 E Adams Ave
- 204 SE 4th St
- 608 E Jefferson Ave
- 607 E Jefferson Ave
- 100 E Madison Ave
- 205 W Madison Ave
- 606 E Monroe Ave
- 107 W Van Buren Ave
- 305 E Van Buren Ave
- 831 County Road 2480e
- 2735 E Washington Rd
- 15508 County Road 400 E
- 114 N Washington St