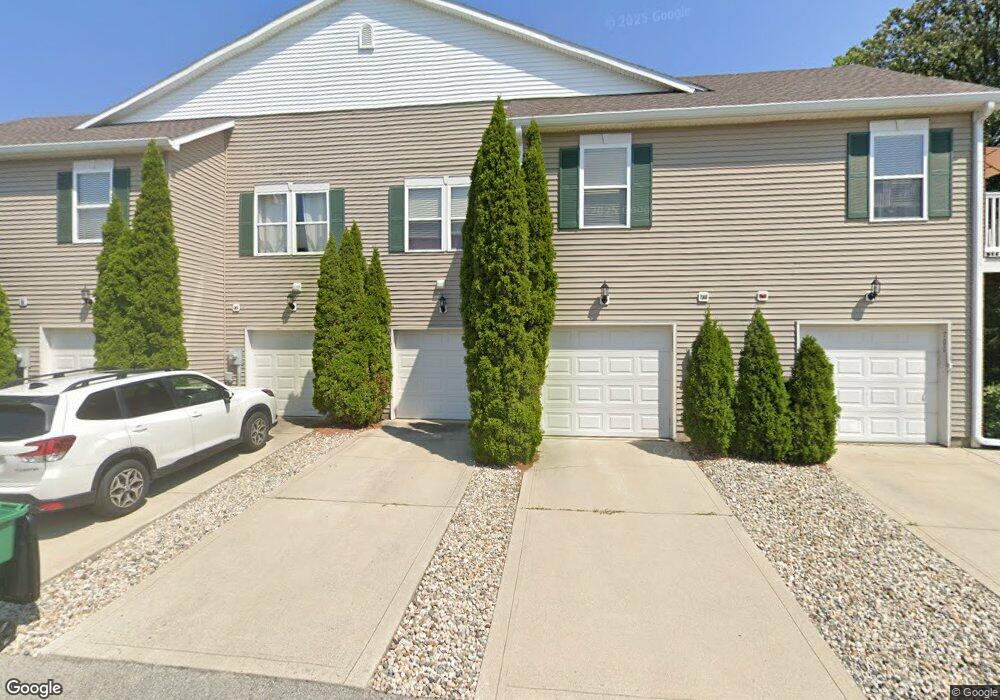
12235 Bubbling Brook Dr Unit 6 Fishers, IN 46038
Estimated Value: $243,000 - $284,000
3
Beds
3
Baths
1,670
Sq Ft
$154/Sq Ft
Est. Value
About This Home
This home is located at 12235 Bubbling Brook Dr Unit 6, Fishers, IN 46038 and is currently estimated at $256,459, approximately $153 per square foot. 12235 Bubbling Brook Dr Unit 6 is a home located in Hamilton County with nearby schools including Sand Creek Elementary School, Sand Creek Intermediate School, and Fishers Junior High School.
Ownership History
Date
Name
Owned For
Owner Type
Purchase Details
Closed on
Oct 19, 2010
Sold by
Brewer Jackie D
Bought by
Pierce Andrea D
Current Estimated Value
Home Financials for this Owner
Home Financials are based on the most recent Mortgage that was taken out on this home.
Original Mortgage
$88,200
Outstanding Balance
$57,727
Interest Rate
4.19%
Mortgage Type
New Conventional
Estimated Equity
$198,732
Purchase Details
Closed on
Jul 9, 2010
Sold by
Kautz Joseph J
Bought by
Brewer Jackie D
Purchase Details
Closed on
Jun 29, 2010
Sold by
Lucchesi Jason
Bought by
Kautz Joseph J
Purchase Details
Closed on
Oct 27, 2006
Sold by
Centex Homes
Bought by
Kautz Joseph J
Home Financials for this Owner
Home Financials are based on the most recent Mortgage that was taken out on this home.
Original Mortgage
$94,291
Interest Rate
6.4%
Mortgage Type
Purchase Money Mortgage
Create a Home Valuation Report for This Property
The Home Valuation Report is an in-depth analysis detailing your home's value as well as a comparison with similar homes in the area
Home Values in the Area
Average Home Value in this Area
Purchase History
| Date | Buyer | Sale Price | Title Company |
|---|---|---|---|
| Pierce Andrea D | -- | Chicago Title Insurance Co | |
| Brewer Jackie D | -- | Chicago Title Insurance Co | |
| Kautz Joseph J | -- | Chicago Title Insurance Co | |
| Kautz Joseph J | -- | None Available |
Source: Public Records
Mortgage History
| Date | Status | Borrower | Loan Amount |
|---|---|---|---|
| Open | Pierce Andrea D | $88,200 | |
| Previous Owner | Kautz Joseph J | $94,291 |
Source: Public Records
Tax History Compared to Growth
Tax History
| Year | Tax Paid | Tax Assessment Tax Assessment Total Assessment is a certain percentage of the fair market value that is determined by local assessors to be the total taxable value of land and additions on the property. | Land | Improvement |
|---|---|---|---|---|
| 2024 | $1,767 | $205,400 | $24,000 | $181,400 |
| 2023 | $1,767 | $183,900 | $24,000 | $159,900 |
| 2022 | $1,415 | $160,000 | $24,000 | $136,000 |
| 2021 | $1,415 | $145,100 | $24,000 | $121,100 |
| 2020 | $1,352 | $138,000 | $24,000 | $114,000 |
| 2019 | $1,120 | $122,100 | $20,900 | $101,200 |
| 2018 | $1,137 | $123,200 | $20,900 | $102,300 |
| 2017 | $931 | $110,100 | $20,900 | $89,200 |
| 2016 | $889 | $107,600 | $20,900 | $86,700 |
| 2014 | $741 | $103,000 | $20,900 | $82,100 |
| 2013 | $741 | $103,900 | $20,900 | $83,000 |
Source: Public Records
Map
Nearby Homes
- 12075 Scoria Dr Unit 500
- 13415 White Granite Dr Unit 600
- 13410 White Granite Dr Unit 1100
- 12523 Courage Crossing
- 12236 Quarterback Ln
- 12552 Majestic Way
- 13355 Heroic Way
- 12404 Titans Dr
- 12632 Endurance Dr
- 12640 Justice Crossing
- 12607 Courage Crossing
- 12639 Justice Crossing
- 12649 Endurance Dr
- 12694 Justice Crossing
- 12599 Brookdale Dr
- 12670 E 131st St
- 12890 Old Glory Dr
- 13855 Boulder Canyon Dr
- 12957 E 131st St
- 12635 Touchdown Dr
- 12235 Bubbling Brook Dr Unit 1200
- 12235 Bubbling Brook Dr Unit 300
- 12235 Bubbling Brook Dr Unit 1100
- 12235 Bubbling Brook Dr Unit 600
- 12235 Bubbling Brook Dr Unit 6
- 12235 Bubbling Brook Dr Unit 6
- 12235 Bubbling Brook Dr Unit 6
- 12235 Bubbling Brook Dr Unit 6
- 12235 Bubbling Brook Dr Unit 6
- 12235 Bubbling Brook Dr Unit 6
- 12235 Bubbling Brook Dr Unit 6
- 12235 Bubbling Brook Dr Unit 6
- 12235 Bubbling Brook Dr Unit 6
- 12235 Bubbling Brook Dr Unit 6
- 12235 Bubbling Brook Dr Unit 6
- 12235 Bubbling Brook Dr Unit 200
- 12235 Bubbling Brook Dr Unit 1000
- 12235 Bubbling Brook Dr
- 12235 Bubbling Brook Dr Unit 900
- 12235 Bubbling Brook Dr Unit 100