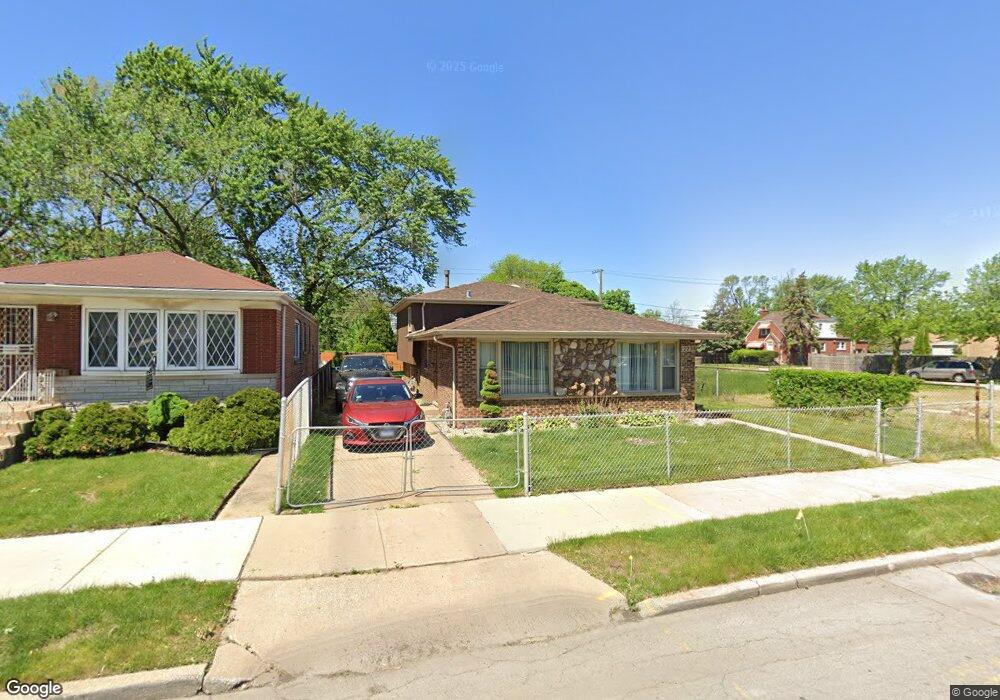
12238 S Michigan Ave Chicago, IL 60628
West Pullman NeighborhoodEstimated Value: $151,000 - $238,000
3
Beds
2
Baths
1,275
Sq Ft
$161/Sq Ft
Est. Value
About This Home
This home is located at 12238 S Michigan Ave, Chicago, IL 60628 and is currently estimated at $205,127, approximately $160 per square foot. 12238 S Michigan Ave is a home located in Cook County with nearby schools including Gompers Elementary Fine Arts Opt School, Corliss High School, and Chicago Collegiate Charter School.
Ownership History
Date
Name
Owned For
Owner Type
Purchase Details
Closed on
Nov 30, 2005
Sold by
Heard Darnell and Heard Sharon
Bought by
Brent Maurice A and Brent Angela
Current Estimated Value
Home Financials for this Owner
Home Financials are based on the most recent Mortgage that was taken out on this home.
Original Mortgage
$126,022
Outstanding Balance
$70,970
Interest Rate
6.4%
Mortgage Type
FHA
Estimated Equity
$134,157
Purchase Details
Closed on
Mar 25, 1998
Sold by
Bankers Trust Company Of California Na
Bought by
Heard Darnell and Heard Sharon
Home Financials for this Owner
Home Financials are based on the most recent Mortgage that was taken out on this home.
Original Mortgage
$79,950
Interest Rate
6.83%
Mortgage Type
FHA
Purchase Details
Closed on
Feb 27, 1997
Sold by
Va
Bought by
Bankers Trust Company Of California Na and Vendee Mtg Trust 1997-1
Create a Home Valuation Report for This Property
The Home Valuation Report is an in-depth analysis detailing your home's value as well as a comparison with similar homes in the area
Home Values in the Area
Average Home Value in this Area
Purchase History
| Date | Buyer | Sale Price | Title Company |
|---|---|---|---|
| Brent Maurice A | $128,000 | Git | |
| Heard Darnell | -- | -- | |
| Bankers Trust Company Of California Na | -- | Intercounty Title |
Source: Public Records
Mortgage History
| Date | Status | Borrower | Loan Amount |
|---|---|---|---|
| Open | Brent Maurice A | $126,022 | |
| Previous Owner | Heard Darnell | $79,950 |
Source: Public Records
Tax History Compared to Growth
Tax History
| Year | Tax Paid | Tax Assessment Tax Assessment Total Assessment is a certain percentage of the fair market value that is determined by local assessors to be the total taxable value of land and additions on the property. | Land | Improvement |
|---|---|---|---|---|
| 2024 | $2,078 | $15,000 | $7,500 | $7,500 |
| 2023 | $2,005 | $13,139 | $7,188 | $5,951 |
| 2022 | $2,005 | $13,139 | $7,188 | $5,951 |
| 2021 | $1,978 | $13,138 | $7,187 | $5,951 |
| 2020 | $1,827 | $11,283 | $4,062 | $7,221 |
| 2019 | $1,835 | $12,537 | $4,062 | $8,475 |
| 2018 | $1,802 | $12,537 | $4,062 | $8,475 |
| 2017 | $2,609 | $15,470 | $3,750 | $11,720 |
| 2016 | $2,605 | $15,470 | $3,750 | $11,720 |
| 2015 | $2,360 | $15,470 | $3,750 | $11,720 |
| 2014 | $2,136 | $14,051 | $3,125 | $10,926 |
| 2013 | $2,082 | $14,051 | $3,125 | $10,926 |
Source: Public Records
Map
Nearby Homes
- 12205 S State St
- 12211 S Lafayette Ave
- 53 W 123rd St
- 12336 S Lafayette Ave
- 12157 S Perry Ave
- 12330 S Perry Ave
- 12346 S Indiana Ave
- 12432 S State St
- 12217 S La Salle St
- 12053 S Michigan Ave
- 12220 S La Salle St
- 12473 S Wabash Ave
- 12109 S Indiana Ave
- 12511 S State St
- 12446 S Perry Ave
- 149 E 120th Place
- 38 W 125th Place
- 122 E 120th Place
- 61 W 125th St
- 12251 S Yale Ave
- 12244 S Michigan Ave
- 12246 S Michigan Ave
- 35 E 122nd Place
- 12252 S Michigan Ave
- 33 E 122nd Place
- 29 E 122nd Place
- 12224 S Michigan Ave
- 12258 S Michigan Ave
- 32 E 123rd St
- 12239 S Michigan Ave
- 30 E 123rd St
- 34 E 123rd St
- 12241 S Michigan Ave
- 12237 S Michigan Ave
- 12222 S Michigan Ave
- 12245 S Michigan Ave
- 12235 S Michigan Ave
- 12249 S Michigan Ave
- 12218 S Michigan Ave
- 12253 S Michigan Ave