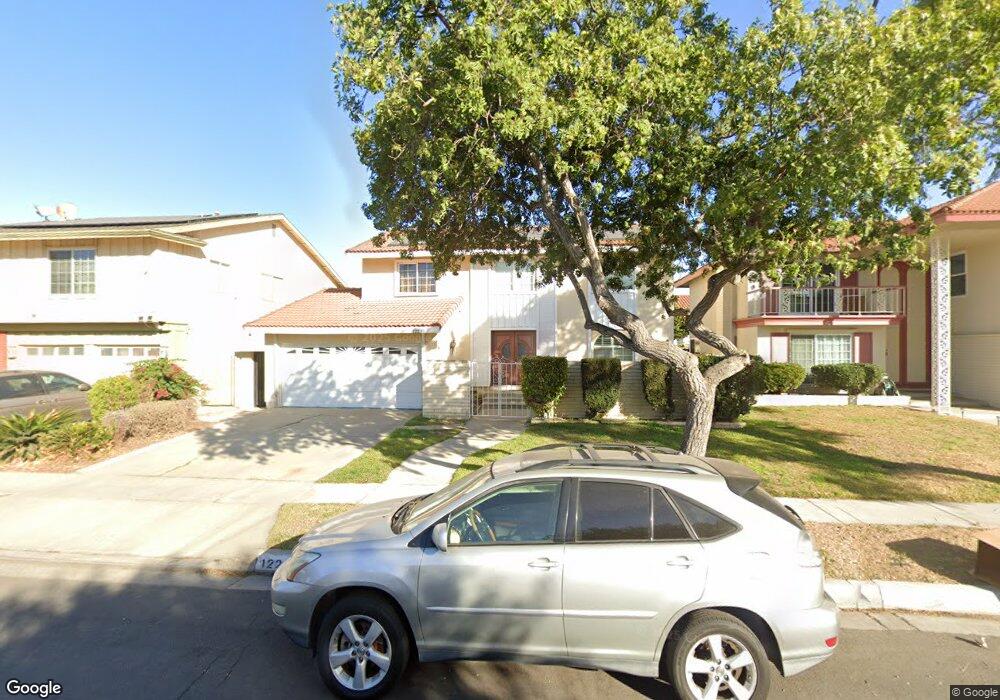
12239 Silva Place Cerritos, CA 90703
Estimated Value: $1,225,000 - $1,399,000
4
Beds
3
Baths
2,429
Sq Ft
$538/Sq Ft
Est. Value
About This Home
This home is located at 12239 Silva Place, Cerritos, CA 90703 and is currently estimated at $1,307,851, approximately $538 per square foot. 12239 Silva Place is a home located in Los Angeles County with nearby schools including Palms Elementary School, Tetzlaff (Martin B.) Middle School, and Artesia High School.
Ownership History
Date
Name
Owned For
Owner Type
Purchase Details
Closed on
Aug 21, 2020
Sold by
Dawson Arthur and Dawson Lucy
Bought by
Dawson Arthur E and Dawson Lucy A
Current Estimated Value
Home Financials for this Owner
Home Financials are based on the most recent Mortgage that was taken out on this home.
Original Mortgage
$280,000
Outstanding Balance
$223,874
Interest Rate
3%
Mortgage Type
New Conventional
Estimated Equity
$1,083,977
Purchase Details
Closed on
Dec 4, 2014
Sold by
Dawson Arthur E
Bought by
Dawson Family Revocable Living Trust
Purchase Details
Closed on
Jul 16, 1996
Sold by
Lee Byung Yup
Bought by
Dawson Arthur E and Dawson Lucy A
Home Financials for this Owner
Home Financials are based on the most recent Mortgage that was taken out on this home.
Original Mortgage
$195,000
Interest Rate
8.23%
Create a Home Valuation Report for This Property
The Home Valuation Report is an in-depth analysis detailing your home's value as well as a comparison with similar homes in the area
Home Values in the Area
Average Home Value in this Area
Purchase History
| Date | Buyer | Sale Price | Title Company |
|---|---|---|---|
| Dawson Arthur E | -- | North American Title Company | |
| Dawson Arthur | -- | North American Title Company | |
| Dawson Family Revocable Living Trust | -- | None Available | |
| Dawson Arthur E | $260,000 | Stewart Title |
Source: Public Records
Mortgage History
| Date | Status | Borrower | Loan Amount |
|---|---|---|---|
| Open | Dawson Arthur | $280,000 | |
| Closed | Dawson Arthur E | $195,000 |
Source: Public Records
Tax History
| Year | Tax Paid | Tax Assessment Tax Assessment Total Assessment is a certain percentage of the fair market value that is determined by local assessors to be the total taxable value of land and additions on the property. | Land | Improvement |
|---|---|---|---|---|
| 2025 | $5,328 | $423,428 | $175,068 | $248,360 |
| 2024 | $5,328 | $415,127 | $171,636 | $243,491 |
| 2023 | $5,161 | $406,988 | $168,271 | $238,717 |
| 2022 | $5,083 | $399,009 | $164,972 | $234,037 |
| 2021 | $4,958 | $391,187 | $161,738 | $229,449 |
| 2019 | $4,847 | $379,587 | $156,942 | $222,645 |
| 2018 | $4,450 | $372,145 | $153,865 | $218,280 |
| 2016 | $4,258 | $357,696 | $147,892 | $209,804 |
| 2015 | $4,205 | $352,324 | $145,671 | $206,653 |
| 2014 | $4,126 | $345,423 | $142,818 | $202,605 |
Source: Public Records
Map
Nearby Homes
- 19922 Rainbow Way
- 12036 Wendy St
- 19705 Teresa Ct
- 12143 Phoenix Dr
- 12233 Academy Way
- 11975 Gonsalves St
- 12022 207th St
- 11974 Bos St
- 20802 Ely Ave
- 20823 Norwalk Blvd Unit 26
- 12526 Chadwell St
- 20603 Seine Ave
- 20807 Elaine Ave Unit 4
- 12141 Centralia St Unit 206
- 12141 Centralia St Unit 111
- 12141 Centralia St Unit 309
- 12141 Centralia St Unit 119
- 12121 Centralia St Unit 111
- 20020 Alburtis Ave
- 12711 Castleford Ln
- 12245 Silva Place
- 12235 Silva Place
- 12240 Eckleson Place
- 12229 Silva Place
- 12246 Eckleson Place
- 12236 Eckleson Place
- 12251 Silva Place
- 12252 Eckleson Place
- 12230 Eckleson Place
- 12240 Silva Place
- 12236 Silva Place
- 12223 Silva Place
- 12246 Silva Place
- 12230 Silva Place
- 12257 Silva Place
- 12224 Eckleson Place
- 12252 Silva Place
- 12258 Eckleson Place
- 12224 Silva Place
- 12217 Silva Place
Your Personal Tour Guide
Ask me questions while you tour the home.