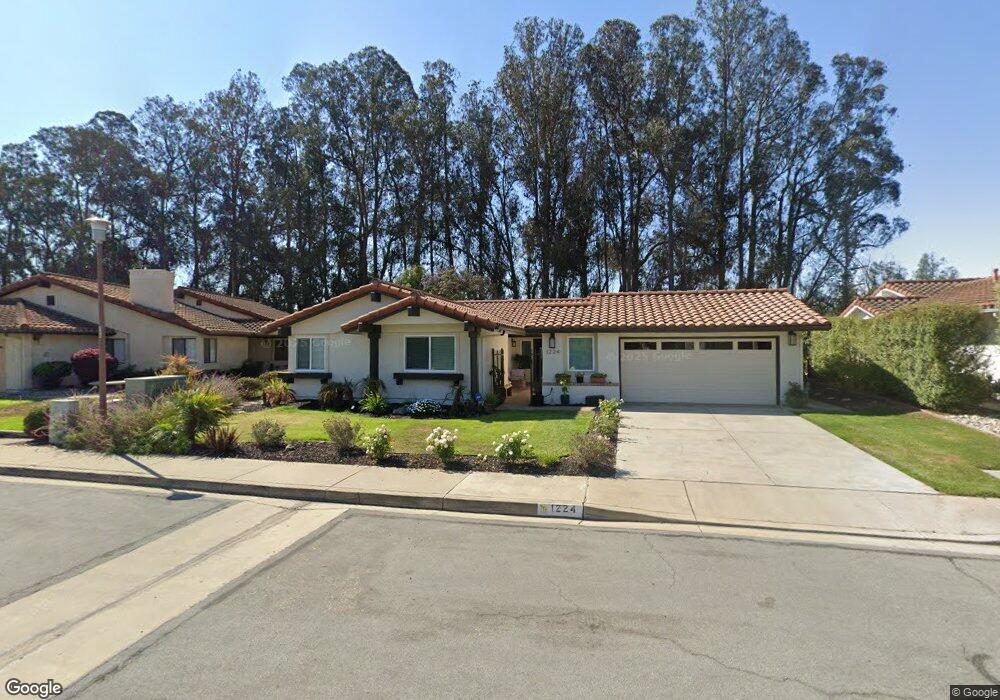
1224 Black Sage Cir Nipomo, CA 93444
Blacklake NeighborhoodEstimated Value: $880,000 - $982,000
4
Beds
3
Baths
2,136
Sq Ft
$426/Sq Ft
Est. Value
About This Home
This home is located at 1224 Black Sage Cir, Nipomo, CA 93444 and is currently estimated at $909,597, approximately $425 per square foot. 1224 Black Sage Cir is a home located in San Luis Obispo County with nearby schools including Dorothea Lange Elementary School, Mesa Middle School, and Nipomo High School.
Ownership History
Date
Name
Owned For
Owner Type
Purchase Details
Closed on
Jul 23, 2024
Sold by
Santana Kerri J
Bought by
Kern Santana Revocable Living Trust and Santana
Current Estimated Value
Purchase Details
Closed on
Feb 9, 2021
Sold by
Santana August J and Santana Kerri J
Bought by
Santana Kerri J
Purchase Details
Closed on
Sep 7, 2010
Sold by
Noia Todd D and Noia Trust
Bought by
Santana August J and Santana Kerri J
Home Financials for this Owner
Home Financials are based on the most recent Mortgage that was taken out on this home.
Original Mortgage
$407,442
Interest Rate
4.26%
Mortgage Type
VA
Purchase Details
Closed on
May 14, 2004
Sold by
Noia Dora F
Bought by
Noia Dora F and Noia Todd D
Create a Home Valuation Report for This Property
The Home Valuation Report is an in-depth analysis detailing your home's value as well as a comparison with similar homes in the area
Home Values in the Area
Average Home Value in this Area
Purchase History
| Date | Buyer | Sale Price | Title Company |
|---|---|---|---|
| Kern Santana Revocable Living Trust | -- | None Listed On Document | |
| Santana Kerri J | -- | Timios Title | |
| Santana August J | $395,000 | First American Title Company | |
| Noia Dora F | -- | -- |
Source: Public Records
Mortgage History
| Date | Status | Borrower | Loan Amount |
|---|---|---|---|
| Previous Owner | Santana August J | $407,442 |
Source: Public Records
Tax History Compared to Growth
Tax History
| Year | Tax Paid | Tax Assessment Tax Assessment Total Assessment is a certain percentage of the fair market value that is determined by local assessors to be the total taxable value of land and additions on the property. | Land | Improvement |
|---|---|---|---|---|
| 2025 | $6,319 | $506,052 | $192,170 | $313,882 |
| 2024 | $6,267 | $496,130 | $188,402 | $307,728 |
| 2023 | $6,267 | $486,403 | $184,708 | $301,695 |
| 2022 | $6,200 | $476,867 | $181,087 | $295,780 |
| 2021 | $5,035 | $467,518 | $177,537 | $289,981 |
| 2020 | $4,977 | $462,725 | $175,717 | $287,008 |
| 2019 | $4,945 | $453,653 | $172,272 | $281,381 |
| 2018 | $4,886 | $444,759 | $168,895 | $275,864 |
| 2017 | $4,788 | $436,039 | $165,584 | $270,455 |
| 2016 | $4,517 | $427,490 | $162,338 | $265,152 |
| 2015 | $4,451 | $421,070 | $159,900 | $261,170 |
| 2014 | $4,287 | $412,823 | $156,768 | $256,055 |
Source: Public Records
Map
Nearby Homes
- 639 Barberry Way
- 1337 Black Sage Cir
- 1150 Redberry Place
- 1060 Dawn Rd
- 1225 Dawn Rd
- 940 Calle Fresa
- 1024 Maggie Ln
- 1276 Pomeroy Rd
- 1354 Trail View Place
- 1084 Emma Ln
- 961 Jacqueline Place
- 977 Jacqueline Place
- 808 Albert Way
- 708 Albert Way
- 1441 Vicki Ln
- 1539 Vista Tesoro Place
- 462 Camino Perillo
- 1790 Calle Laguna
- 1255 Viva Way
- 1147 Vaquero Way
- 1228 Black Sage Cir
- 1220 Black Sage Cir
- 1230 Black Sage Cir
- 681 Barberry Way
- 1216 Black Sage Cir
- 684 Barberry Way
- 1212 Black Sage Cir
- 678 Barberry Way
- 1238 Black Sage Cir
- 667 Barberry Way
- 672 Barberry Way
- 1240 Black Sage Cir
- 666 Barberry Way
- 1247 Black Sage Cir
- 1244 Black Sage Cir
- 664 Barberry Way
- 660 Barberry Way
- 645 Barberry Way
- 1249 Black Sage Cir