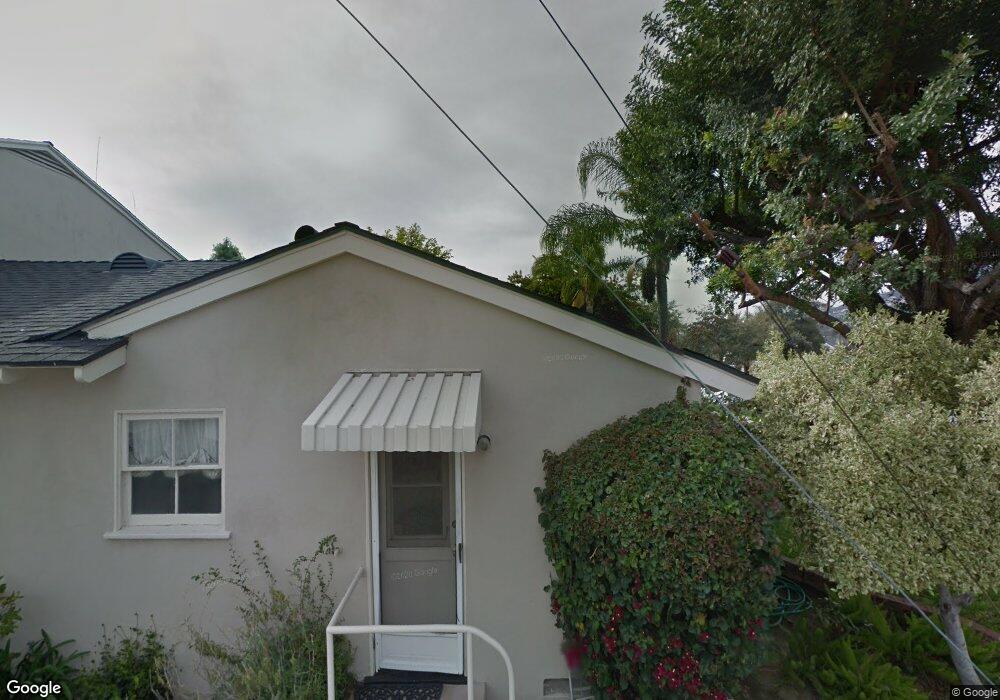
1224 E Glenoaks Blvd Unit 1 Glendale, CA 91206
Woodbury NeighborhoodEstimated Value: $480,000 - $599,000
2
Beds
1
Bath
896
Sq Ft
$621/Sq Ft
Est. Value
About This Home
This home is located at 1224 E Glenoaks Blvd Unit 1, Glendale, CA 91206 and is currently estimated at $556,611, approximately $621 per square foot. 1224 E Glenoaks Blvd Unit 1 is a home located in Los Angeles County with nearby schools including R.D. White Elementary School, Woodrow Wilson Middle School, and Glendale High School.
Ownership History
Date
Name
Owned For
Owner Type
Purchase Details
Closed on
Jan 10, 2009
Sold by
Gama Jose M and Gama Gloria R
Bought by
Gama Jose M
Current Estimated Value
Purchase Details
Closed on
Feb 3, 2003
Sold by
Smiles Sherry Lyn
Bought by
Gama Jose M
Home Financials for this Owner
Home Financials are based on the most recent Mortgage that was taken out on this home.
Original Mortgage
$100,000
Outstanding Balance
$42,640
Interest Rate
5.89%
Estimated Equity
$513,971
Purchase Details
Closed on
Nov 13, 1995
Sold by
Lachasse Dean A
Bought by
Smiles Sherry Lyn
Home Financials for this Owner
Home Financials are based on the most recent Mortgage that was taken out on this home.
Original Mortgage
$101,850
Interest Rate
7.14%
Create a Home Valuation Report for This Property
The Home Valuation Report is an in-depth analysis detailing your home's value as well as a comparison with similar homes in the area
Home Values in the Area
Average Home Value in this Area
Purchase History
We collect this data history from publicly available records. To have your information removed, we recommend requesting removal directly through your county’s website.
| Date | Buyer | Sale Price | Title Company |
|---|---|---|---|
| Gama Jose M | -- | None Available | |
| Gama Jose M | $215,000 | Chicago Title Co | |
| Smiles Sherry Lyn | -- | Chicago Title Co | |
| Smiles Sherry Lyn | $105,000 | United Title Company |
Source: Public Records
Mortgage History
We collect this data history from publicly available records. To have your information removed, we recommend requesting removal directly through your county’s website.
| Date | Status | Borrower | Loan Amount |
|---|---|---|---|
| Open | Gama Jose M | $100,000 | |
| Previous Owner | Smiles Sherry Lyn | $101,850 |
Source: Public Records
Tax History
| Year | Tax Paid | Tax Assessment Tax Assessment Total Assessment is a certain percentage of the fair market value that is determined by local assessors to be the total taxable value of land and additions on the property. | Land | Improvement |
|---|---|---|---|---|
| 2025 | $3,524 | $311,369 | $217,239 | $94,130 |
| 2024 | $3,447 | $305,265 | $212,980 | $92,285 |
| 2023 | $3,370 | $299,280 | $208,804 | $90,476 |
| 2022 | $3,309 | $293,412 | $204,710 | $88,702 |
| 2021 | $3,251 | $287,660 | $200,697 | $86,963 |
| 2019 | $3,126 | $279,131 | $194,746 | $84,385 |
| 2018 | $3,069 | $273,659 | $190,928 | $82,731 |
| 2016 | $2,924 | $263,034 | $183,515 | $79,519 |
| 2015 | $2,865 | $259,084 | $180,759 | $78,325 |
| 2014 | $2,845 | $254,010 | $177,219 | $76,791 |
Source: Public Records
Map
Nearby Homes
- 817 N Verdugo Rd
- 630 Naranja Dr
- 900 Glenvista Dr
- 606 Galer Place
- 537 N Adams St Unit 212
- 1117 Viscano Dr
- 755 Luton Dr
- 444 Piedmont Ave Unit 129
- 924 E Glenoaks Blvd
- 861 Monterey Rd
- 1620 Ina Dr
- 335 N Adams St Unit 222
- 335 N Adams St
- 1410 E California Ave
- 729 Glenmore Blvd
- 649 Atkins Dr
- 320 N Belmont St
- 1404 Ethel St
- 1595 E Chevy Chase Dr
- 1317 Sinaloa Dr
- 1224 E Glenoaks Blvd Unit 5
- 1224 E Glenoaks Blvd
- 1224 E Glenoaks Blvd Unit 9
- 1224 E Glenoaks Blvd Unit 8
- 1224 E Glenoaks Blvd Unit 7
- 1224 E Glenoaks Blvd Unit 6
- 1224 E Glenoaks Blvd Unit 4
- 1224 E Glenoaks Blvd Unit 3
- 1224 E Glenoaks Blvd Unit 2
- 1220 E Glenoaks Blvd Unit 3
- 1220 E Glenoaks Blvd Unit 9
- 1220 E Glenoaks Blvd Unit 8
- 1220 E Glenoaks Blvd Unit 7
- 1220 E Glenoaks Blvd Unit 6
- 1220 E Glenoaks Blvd Unit 5
- 1220 E Glenoaks Blvd Unit 4
- 1220 E Glenoaks Blvd
- 1220 E Glenoaks Blvd Unit 2
- 1220 E Glenoaks Blvd Unit 1
- 813 N Verdugo Rd Unit 815 1/2 N Verdugo Rd
Your Personal Tour Guide
Ask me questions while you tour the home.