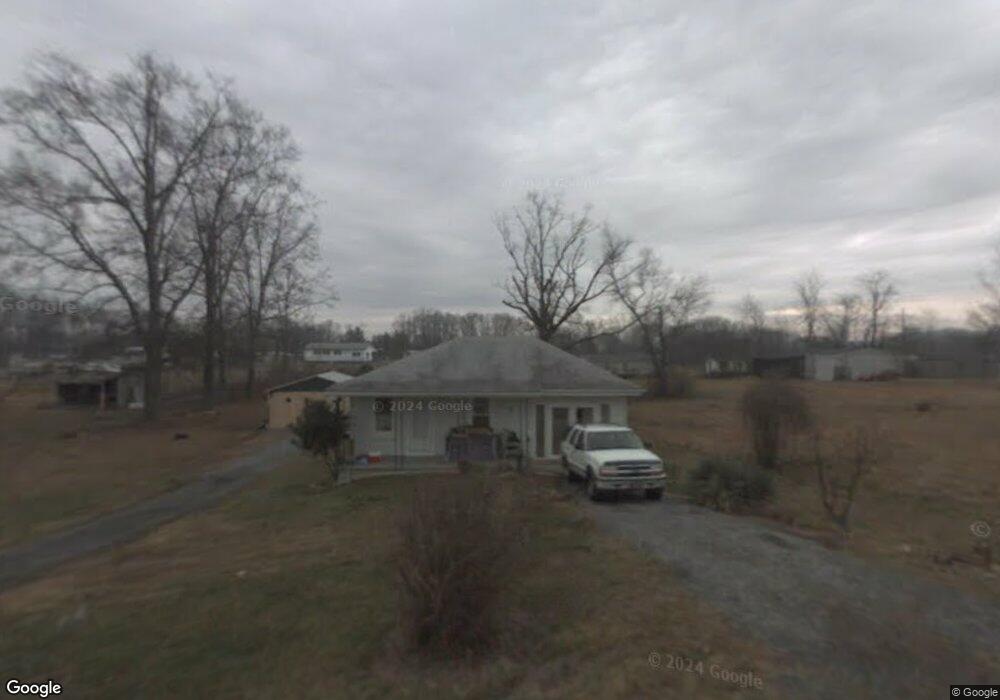
1224 Fine St Newport, TN 37821
Estimated Value: $101,120 - $216,000
--
Bed
1
Bath
1,152
Sq Ft
$140/Sq Ft
Est. Value
About This Home
This home is located at 1224 Fine St, Newport, TN 37821 and is currently estimated at $161,280, approximately $140 per square foot. 1224 Fine St is a home located in Cocke County with nearby schools including Edgemont Elementary School, Cocke County High School, and Calvary Baptist Tabernacle School.
Ownership History
Date
Name
Owned For
Owner Type
Purchase Details
Closed on
Oct 19, 2004
Sold by
Shoemaker Douglas
Bought by
Belcher David Wayne
Current Estimated Value
Purchase Details
Closed on
Jun 24, 2004
Bought by
Belcher David Wayne and Belcher Kimberly Lynn
Purchase Details
Closed on
Jun 10, 2003
Sold by
Baranyai Amarylis C
Bought by
Randolph Clay K
Purchase Details
Closed on
Apr 2, 2003
Bought by
Randolph Clay K and Shoemaker Douglas
Purchase Details
Closed on
May 17, 1995
Sold by
Clevenger Edgar and Clevenger Nora
Bought by
Rhodes Heath
Create a Home Valuation Report for This Property
The Home Valuation Report is an in-depth analysis detailing your home's value as well as a comparison with similar homes in the area
Home Values in the Area
Average Home Value in this Area
Purchase History
| Date | Buyer | Sale Price | Title Company |
|---|---|---|---|
| Belcher David Wayne | $25,000 | -- | |
| Belcher David Wayne | $25,000 | -- | |
| Randolph Clay K | $8,000 | -- | |
| Randolph Clay K | $8,000 | -- | |
| Rhodes Heath | $3,000 | -- |
Source: Public Records
Tax History Compared to Growth
Tax History
| Year | Tax Paid | Tax Assessment Tax Assessment Total Assessment is a certain percentage of the fair market value that is determined by local assessors to be the total taxable value of land and additions on the property. | Land | Improvement |
|---|---|---|---|---|
| 2024 | $340 | $13,300 | $3,050 | $10,250 |
| 2023 | $340 | $13,300 | $3,050 | $10,250 |
| 2022 | $341 | $13,300 | $3,050 | $10,250 |
| 2021 | $341 | $13,300 | $3,050 | $10,250 |
| 2020 | $341 | $13,300 | $3,050 | $10,250 |
| 2019 | $318 | $11,250 | $3,725 | $7,525 |
| 2018 | $318 | $11,250 | $3,725 | $7,525 |
| 2017 | $326 | $11,250 | $3,725 | $7,525 |
| 2016 | $291 | $11,250 | $3,725 | $7,525 |
| 2015 | $323 | $11,250 | $3,725 | $7,525 |
| 2014 | $323 | $11,250 | $3,725 | $7,525 |
| 2013 | $323 | $13,475 | $5,425 | $8,050 |
Source: Public Records
Map
Nearby Homes