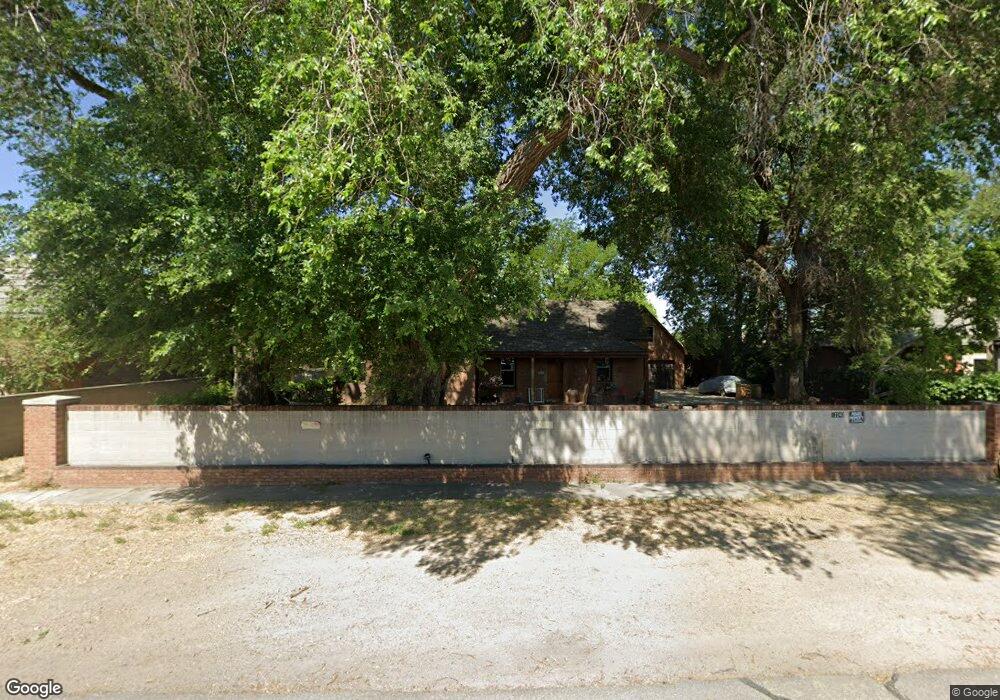
12242 S 800 E Draper, UT 84020
Estimated Value: $563,000 - $645,000
3
Beds
2
Baths
1,715
Sq Ft
$356/Sq Ft
Est. Value
About This Home
This home is located at 12242 S 800 E, Draper, UT 84020 and is currently estimated at $611,383, approximately $356 per square foot. 12242 S 800 E is a home located in Salt Lake County with nearby schools including Sprucewood School, Bell Canyon Montessori School, and St. John the Baptist Catholic Middle School.
Ownership History
Date
Name
Owned For
Owner Type
Purchase Details
Closed on
Nov 19, 2000
Sold by
Dillman Joshua L
Bought by
Dillman Investments Lc
Current Estimated Value
Home Financials for this Owner
Home Financials are based on the most recent Mortgage that was taken out on this home.
Original Mortgage
$115,375
Outstanding Balance
$42,196
Interest Rate
7.96%
Estimated Equity
$569,187
Purchase Details
Closed on
Oct 16, 2000
Sold by
Stedman Joan A and Harrison Joan A
Bought by
Dillman Joshua L
Home Financials for this Owner
Home Financials are based on the most recent Mortgage that was taken out on this home.
Original Mortgage
$115,375
Outstanding Balance
$42,196
Interest Rate
7.96%
Estimated Equity
$569,187
Purchase Details
Closed on
Oct 11, 2000
Sold by
Stedman Adam
Bought by
Stedman Joan A Harrison
Home Financials for this Owner
Home Financials are based on the most recent Mortgage that was taken out on this home.
Original Mortgage
$115,375
Outstanding Balance
$42,196
Interest Rate
7.96%
Estimated Equity
$569,187
Purchase Details
Closed on
Feb 1, 1994
Sold by
Harrison Joan A
Bought by
Harrison Joan A and Stedman Adam
Create a Home Valuation Report for This Property
The Home Valuation Report is an in-depth analysis detailing your home's value as well as a comparison with similar homes in the area
Home Values in the Area
Average Home Value in this Area
Purchase History
| Date | Buyer | Sale Price | Title Company |
|---|---|---|---|
| Dillman Investments Lc | -- | Landmark Title | |
| Dillman Joshua L | -- | Salt Lake Title | |
| Stedman Joan A Harrison | -- | Salt Lake Title | |
| Harrison Joan A | -- | -- |
Source: Public Records
Mortgage History
| Date | Status | Borrower | Loan Amount |
|---|---|---|---|
| Open | Dillman Joshua L | $115,375 |
Source: Public Records
Tax History
| Year | Tax Paid | Tax Assessment Tax Assessment Total Assessment is a certain percentage of the fair market value that is determined by local assessors to be the total taxable value of land and additions on the property. | Land | Improvement |
|---|---|---|---|---|
| 2025 | $2,661 | $540,200 | $159,800 | $380,400 |
| 2024 | $2,661 | $508,300 | $150,700 | $357,600 |
| 2023 | $2,973 | $497,800 | $143,200 | $354,600 |
| 2022 | $3,157 | $514,500 | $140,400 | $374,100 |
| 2021 | $2,806 | $384,500 | $108,100 | $276,400 |
| 2020 | $2,734 | $359,100 | $108,100 | $251,000 |
| 2019 | $2,251 | $326,200 | $101,900 | $224,300 |
| 2016 | $2,218 | $258,000 | $101,900 | $156,100 |
Source: Public Records
Map
Nearby Homes
- 834 E 12085 S
- 657 E Vandalay Ln
- 633 E Vandalay Ln
- 902 E 12650 S
- 480 E Foxstone Cove
- 12161 S Spring Ridge Cir
- 1137 Parkstone Dr
- 352 E Mistilake Ln Unit 20
- 847 E Willow Springs Ln
- 311 E Unchartered Ln
- 1187 E Parkstone Dr
- 1139 Hidden Valley Dr
- 622 E Sawback Ln
- 11743 S 700 E
- 8858 S Willow Wood Dr
- 11737 S Nigel Peak Ln
- 11685 S Auburn Fields Way
- 224 Spencer Peak Way Unit F6
- 622 Wyngate Pointe Ln
- 654 Wyngate Pointe Ln
- 12230 S 800 E
- 12216 S 800 E
- 12272 S 800 E Unit 100
- 12215 S 800 E
- 11560 S 800 E
- 14700 S 800 E Unit 63
- 14700 S 800 E Unit 62
- 14700 S 800 E Unit 61
- 14700 S 800 E Unit 52
- 14700 S 800 E Unit 51
- 14700 S 800 E Unit 50
- 14700 S 800 E Unit 49
- 14700 S 800 E Unit 48
- 14700 S 800 E Unit 47
- 14700 S 800 E Unit 121
- 14700 S 800 E Unit 120
- 14700 S 800 E Unit 119
- 14700 S 800 E Unit 118
- 14700 S 800 E Unit 117
- 14700 S 800 E Unit 85
Your Personal Tour Guide
Ask me questions while you tour the home.