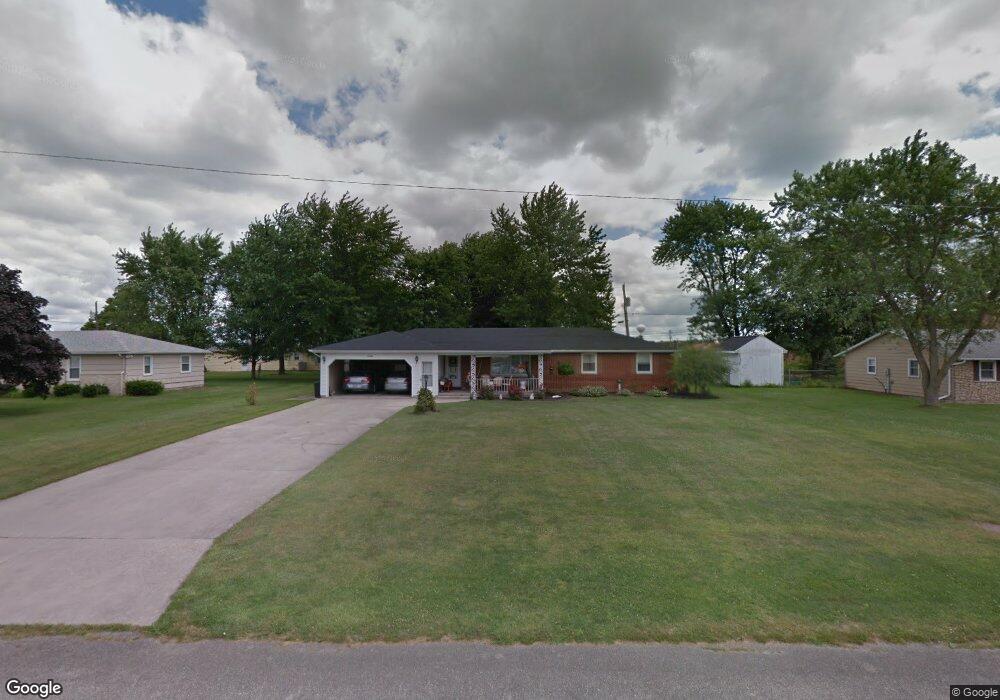
12244 Maple Ave Paulding, OH 45879
Estimated Value: $185,691 - $245,000
3
Beds
2
Baths
1,638
Sq Ft
$132/Sq Ft
Est. Value
About This Home
This home is located at 12244 Maple Ave, Paulding, OH 45879 and is currently estimated at $215,923, approximately $131 per square foot. 12244 Maple Ave is a home located in Paulding County with nearby schools including Paulding High School.
Ownership History
Date
Name
Owned For
Owner Type
Purchase Details
Closed on
Dec 21, 2006
Sold by
Grant Louise E and Goodall Emma Lynne
Bought by
Stevenson Sally Ann
Current Estimated Value
Purchase Details
Closed on
Apr 7, 2006
Sold by
Grant Rodgers L and Grant Louise E
Bought by
Grant Louise E and Stevenson Sally Ann
Home Financials for this Owner
Home Financials are based on the most recent Mortgage that was taken out on this home.
Original Mortgage
$68,380
Interest Rate
6.2%
Mortgage Type
New Conventional
Purchase Details
Closed on
Feb 16, 2006
Sold by
Krick David A and Krick Michelle D
Bought by
Grnt Rodgers L and Grant Louise E
Home Financials for this Owner
Home Financials are based on the most recent Mortgage that was taken out on this home.
Original Mortgage
$68,380
Interest Rate
6.2%
Mortgage Type
New Conventional
Purchase Details
Closed on
May 20, 2005
Sold by
Estate Of Margie M Krick
Bought by
Krick David A and Krick Robert P
Create a Home Valuation Report for This Property
The Home Valuation Report is an in-depth analysis detailing your home's value as well as a comparison with similar homes in the area
Home Values in the Area
Average Home Value in this Area
Purchase History
| Date | Buyer | Sale Price | Title Company |
|---|---|---|---|
| Stevenson Sally Ann | -- | None Available | |
| Grant Louise E | -- | None Available | |
| Grnt Rodgers L | $85,000 | None Available | |
| Krick David A | -- | None Available |
Source: Public Records
Mortgage History
| Date | Status | Borrower | Loan Amount |
|---|---|---|---|
| Previous Owner | Grnt Rodgers L | $68,380 |
Source: Public Records
Tax History
| Year | Tax Paid | Tax Assessment Tax Assessment Total Assessment is a certain percentage of the fair market value that is determined by local assessors to be the total taxable value of land and additions on the property. | Land | Improvement |
|---|---|---|---|---|
| 2025 | $2,326 | $63,420 | $13,650 | $49,770 |
| 2024 | $2,326 | $48,790 | $10,500 | $38,290 |
| 2023 | $1,753 | $48,790 | $10,500 | $38,290 |
| 2022 | $1,760 | $48,790 | $10,500 | $38,290 |
| 2021 | $1,404 | $37,350 | $7,880 | $29,470 |
| 2020 | $1,261 | $37,350 | $7,880 | $29,470 |
| 2019 | $1,271 | $34,660 | $7,880 | $26,780 |
| 2018 | $1,169 | $34,660 | $7,880 | $26,780 |
| 2017 | $1,170 | $34,660 | $7,880 | $26,780 |
| 2016 | $1,175 | $34,660 | $7,880 | $26,780 |
| 2015 | $1,072 | $32,730 | $7,880 | $24,850 |
| 2014 | $1,067 | $32,730 | $7,880 | $24,850 |
| 2013 | $1,148 | $32,730 | $7,880 | $24,850 |
Source: Public Records
Map
Nearby Homes
- 830 N Walnut St
- 780 N Williams St
- 726 N Main St
- 829 Greenbriar Ave
- 1065 Emerald Rd
- 741 Tom Tim Dr
- 516 N Williams St
- 402 N Williams St
- 308 N Main St
- 301 N Main St
- 508 W Jackson St
- 215 N Dewitt St
- 13688 Kay St
- 614 W Jackson St
- 520 W Wayne St
- 717 W Harrison St
- 714 W Wayne St
- 701 E Wayne St
- 742 E Perry St
- 11051 Road 93
- 12172 Maple Ave
- 12320 Maple Ave
- 12221 Maple Ave
- 1014 N Williams St
- 12281 Maple Ave
- 1020 N Williams St
- 12388 Maple Ave
- 12147 Maple Ave
- 12353 Maple Ave
- 1028 N Williams St
- 12091 Maple Ave
- 12438 Maple Ave
- 12415 Maple Ave
- 1036 N Williams St
- 1019 N Williams St
- 12464 Maple Ave
- 12035 Maple Ave
- 12487 Maple Ave
- 12532 Maple Ave
- 1048 N Williams St
Your Personal Tour Guide
Ask me questions while you tour the home.