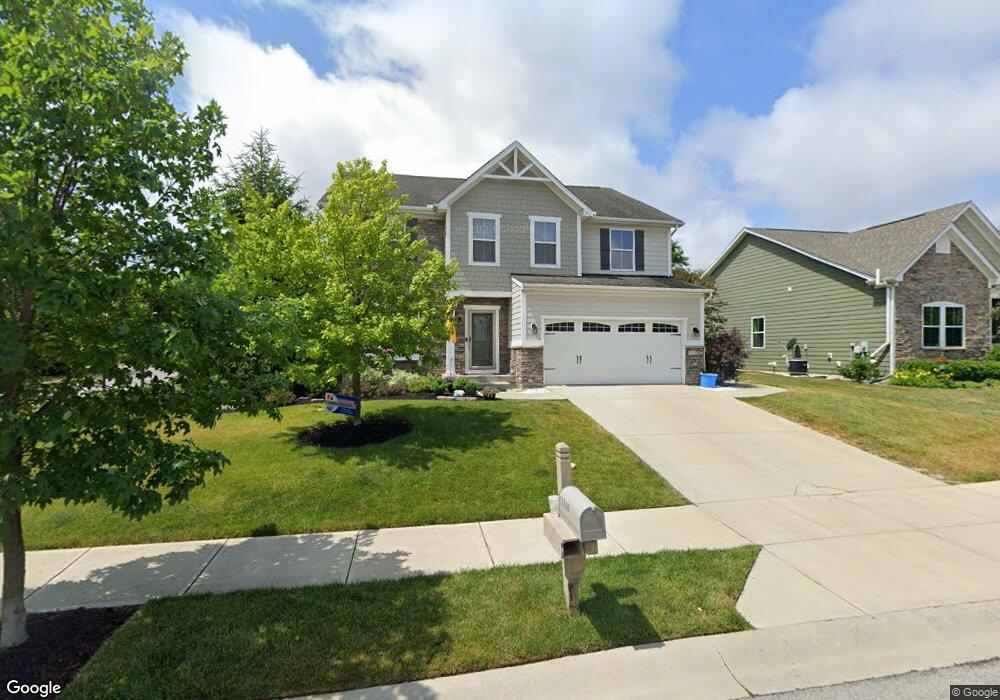
12248 Hawks Nest Dr Fishers, IN 46037
Estimated Value: $552,000 - $622,000
4
Beds
5
Baths
3,223
Sq Ft
$178/Sq Ft
Est. Value
About This Home
This home is located at 12248 Hawks Nest Dr, Fishers, IN 46037 and is currently estimated at $573,806, approximately $178 per square foot. 12248 Hawks Nest Dr is a home located in Hamilton County with nearby schools including Fall Creek Elementary School, Fall Creek Intermediate School, and Hamilton Southeastern High School.
Ownership History
Date
Name
Owned For
Owner Type
Purchase Details
Closed on
Nov 12, 2014
Sold by
Followell Paul R and Followell Kathleen J
Bought by
Medcalfe Luke and Medcalfe Jennifer
Current Estimated Value
Home Financials for this Owner
Home Financials are based on the most recent Mortgage that was taken out on this home.
Original Mortgage
$294,500
Outstanding Balance
$225,347
Interest Rate
3.97%
Mortgage Type
New Conventional
Estimated Equity
$348,459
Purchase Details
Closed on
Mar 28, 2011
Sold by
Nvr Inc
Bought by
Followell Paul R and Followell Kathleen J
Home Financials for this Owner
Home Financials are based on the most recent Mortgage that was taken out on this home.
Original Mortgage
$223,992
Interest Rate
5.04%
Mortgage Type
New Conventional
Purchase Details
Closed on
Dec 9, 2010
Sold by
R N Thompson Development Corporation
Bought by
Nvr Inc
Create a Home Valuation Report for This Property
The Home Valuation Report is an in-depth analysis detailing your home's value as well as a comparison with similar homes in the area
Home Values in the Area
Average Home Value in this Area
Purchase History
| Date | Buyer | Sale Price | Title Company |
|---|---|---|---|
| Medcalfe Luke | -- | None Available | |
| Followell Paul R | -- | Nvr Title Agency Llc | |
| Nvr Inc | -- | None Available | |
| Nvr Inc | -- | None Available |
Source: Public Records
Mortgage History
| Date | Status | Borrower | Loan Amount |
|---|---|---|---|
| Open | Medcalfe Luke | $294,500 | |
| Previous Owner | Followell Paul R | $223,992 |
Source: Public Records
Tax History Compared to Growth
Tax History
| Year | Tax Paid | Tax Assessment Tax Assessment Total Assessment is a certain percentage of the fair market value that is determined by local assessors to be the total taxable value of land and additions on the property. | Land | Improvement |
|---|---|---|---|---|
| 2024 | $5,120 | $453,600 | $62,700 | $390,900 |
| 2023 | $5,120 | $443,100 | $62,700 | $380,400 |
| 2022 | $4,611 | $384,600 | $62,700 | $321,900 |
| 2021 | $4,073 | $340,300 | $62,700 | $277,600 |
| 2020 | $3,873 | $320,000 | $62,700 | $257,300 |
| 2019 | $3,907 | $322,800 | $62,700 | $260,100 |
| 2018 | $3,656 | $301,700 | $62,700 | $239,000 |
| 2017 | $3,582 | $300,500 | $62,700 | $237,800 |
| 2016 | $3,524 | $295,800 | $62,700 | $233,100 |
| 2014 | $3,329 | $307,000 | $62,700 | $244,300 |
| 2013 | $3,329 | $307,000 | $62,700 | $244,300 |
Source: Public Records
Map
Nearby Homes
- 12438 Hawks Landing Dr
- 11833 Walker Ln
- 14058 Southwood Cir
- 10725 Crum Ct
- 12680 Tamworth Dr
- 13985 Royalwood Dr
- 12706 Hannah Hill Rd
- 12834 Piccadilly Cir
- 11932 Hollyhock Dr
- 12880 Oxbridge Place
- 12419 Brandamore Ln
- 14402 Wolverton Way
- 14156 Avalon Dr E
- 11369 Easterly Blvd
- 12878 Ari Ln
- 12985 Saxony Blvd
- 12004 Gatwick View Dr
- 13665 E 114th St
- 13008 Overview Dr
- 12318 Whispering Breeze Dr
- 12258 Hawks Nest Dr
- 12268 Hawks Nest Dr
- 12278 Hawks Nest Dr
- 12281 Hawks Nest Dr
- 12291 Hawks Nest Dr
- 12271 Hawks Nest Dr
- 12288 Hawks Nest Dr
- 12301 Hawks Nest Dr
- 12298 Hawks Nest Dr
- 12311 Hawks Nest Dr
- 12321 Hawks Nest Dr
- 12318 Hawks Nest Dr
- 12331 Hawks Nest Dr
- 12328 Hawks Nest Dr
- 12341 Hawks Nest Dr
- 12338 Hawks Nest Dr
- 12351 Hawks Nest Dr
- 12361 Hawks Nest Dr
- 13618 Silverstone Dr
- 13629 Hawks Nest Dr