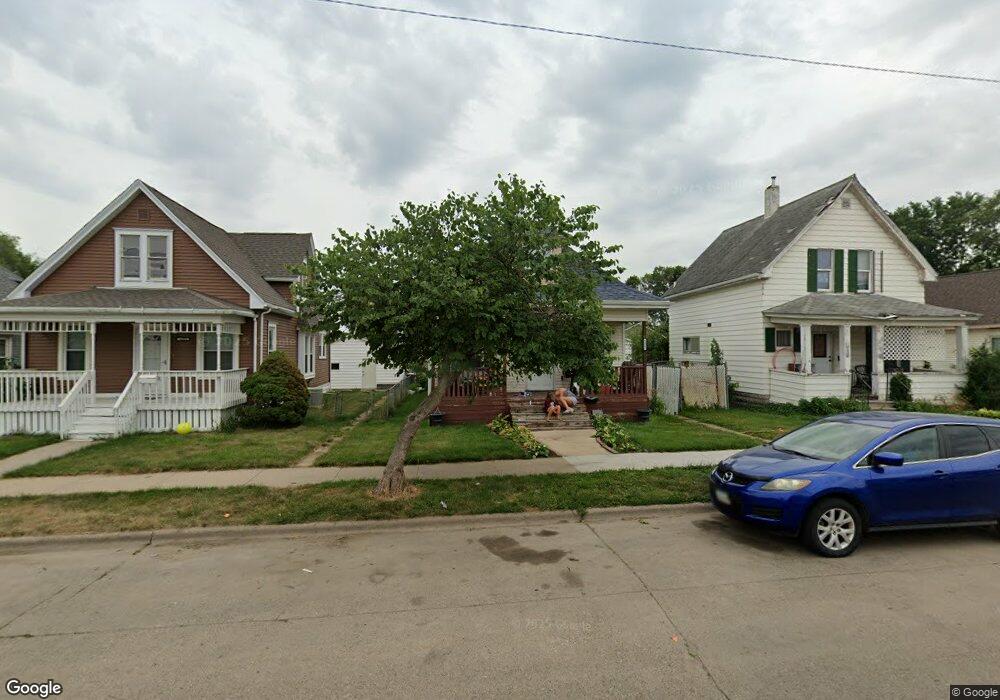
1225 4th St SW Cedar Rapids, IA 52404
Taylor NeighborhoodEstimated Value: $133,000 - $153,000
4
Beds
1
Bath
1,188
Sq Ft
$121/Sq Ft
Est. Value
About This Home
This home is located at 1225 4th St SW, Cedar Rapids, IA 52404 and is currently estimated at $143,736, approximately $120 per square foot. 1225 4th St SW is a home located in Linn County with nearby schools including Cedar River Academy at Taylor Elementary School, Wilson Middle School, and Thomas Jefferson High School.
Ownership History
Date
Name
Owned For
Owner Type
Purchase Details
Closed on
Oct 19, 2016
Sold by
Reicks Properties Llc
Bought by
Franks Brian K
Current Estimated Value
Purchase Details
Closed on
Oct 4, 2016
Sold by
Franks Dawn and Franks Brian K
Bought by
Franks Brian K
Purchase Details
Closed on
Jan 22, 2010
Sold by
Reicks Properties Llc
Bought by
Franks Dawn
Home Financials for this Owner
Home Financials are based on the most recent Mortgage that was taken out on this home.
Original Mortgage
$59,400
Interest Rate
6.5%
Mortgage Type
Seller Take Back
Create a Home Valuation Report for This Property
The Home Valuation Report is an in-depth analysis detailing your home's value as well as a comparison with similar homes in the area
Home Values in the Area
Average Home Value in this Area
Purchase History
| Date | Buyer | Sale Price | Title Company |
|---|---|---|---|
| Franks Brian K | $112 | Attorney | |
| Franks Brian K | -- | None Available | |
| Franks Dawn | $60,000 | None Available |
Source: Public Records
Mortgage History
| Date | Status | Borrower | Loan Amount |
|---|---|---|---|
| Previous Owner | Franks Dawn | $59,400 |
Source: Public Records
Tax History
| Year | Tax Paid | Tax Assessment Tax Assessment Total Assessment is a certain percentage of the fair market value that is determined by local assessors to be the total taxable value of land and additions on the property. | Land | Improvement |
|---|---|---|---|---|
| 2025 | $1,904 | $129,500 | $26,300 | $103,200 |
| 2024 | $1,730 | $118,000 | $24,200 | $93,800 |
| 2023 | $1,730 | $118,000 | $24,200 | $93,800 |
| 2022 | $1,712 | $90,900 | $20,200 | $70,700 |
| 2021 | $1,756 | $82,600 | $20,200 | $62,400 |
| 2020 | $1,756 | $79,600 | $18,200 | $61,400 |
| 2019 | $1,668 | $77,400 | $18,200 | $59,200 |
Source: Public Records
Map
Nearby Homes
Your Personal Tour Guide
Ask me questions while you tour the home.