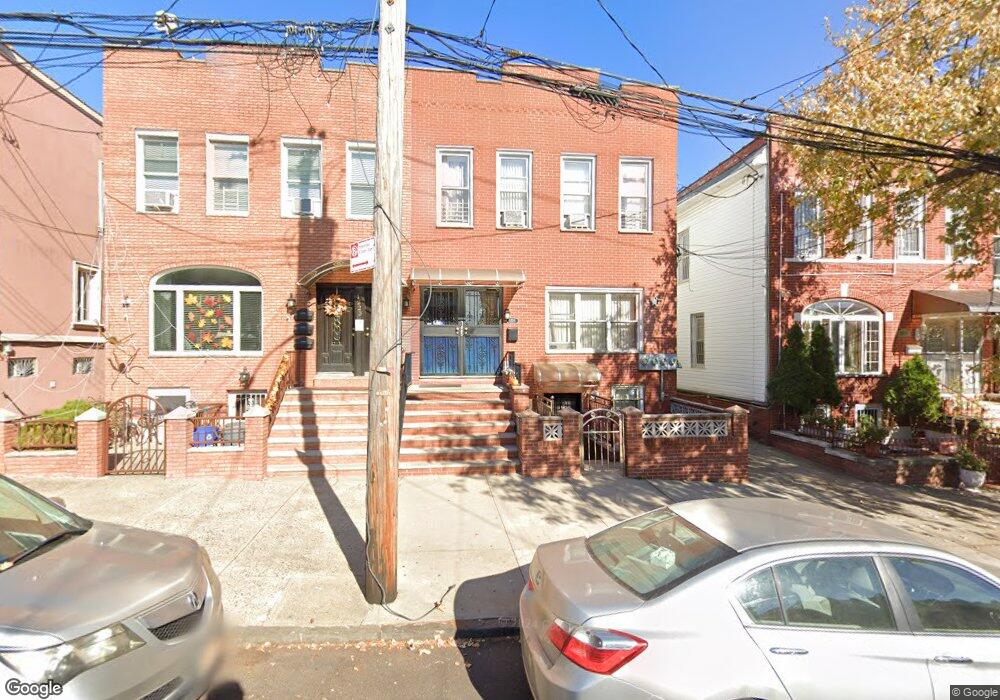
1225 79th St Brooklyn, NY 11228
Dyker Heights NeighborhoodEstimated Value: $1,748,000 - $2,103,504
5
Beds
3
Baths
2,992
Sq Ft
$636/Sq Ft
Est. Value
About This Home
This home is located at 1225 79th St, Brooklyn, NY 11228 and is currently estimated at $1,902,126, approximately $635 per square foot. 1225 79th St is a home located in Kings County with nearby schools including P.S. 204 Vince Lombardi, IS 201 Madeleine Brennan Intermediate School, and New Utrecht High School.
Ownership History
Date
Name
Owned For
Owner Type
Purchase Details
Closed on
Nov 4, 2016
Sold by
Ceci Salvatore
Bought by
Gura Inc
Current Estimated Value
Home Financials for this Owner
Home Financials are based on the most recent Mortgage that was taken out on this home.
Original Mortgage
$750,000
Outstanding Balance
$598,879
Interest Rate
3.42%
Mortgage Type
Purchase Money Mortgage
Estimated Equity
$1,303,247
Purchase Details
Closed on
Jun 13, 2011
Sold by
Ceci Salvatore and D'Amato Elizabeth
Bought by
Ceci Salvatore
Purchase Details
Closed on
Aug 19, 2005
Sold by
Salvatore Ceci Exec Of Estate Of Vincen
Bought by
Ceci Salvatore
Purchase Details
Closed on
Sep 24, 2004
Sold by
Ceci Vincent and D'Amato Elizabeth
Bought by
Ceci Vincent and D'Amato Elizabeth
Purchase Details
Closed on
Sep 6, 1996
Sold by
Damato Elizabeth
Bought by
Damato Elizabeth
Create a Home Valuation Report for This Property
The Home Valuation Report is an in-depth analysis detailing your home's value as well as a comparison with similar homes in the area
Home Values in the Area
Average Home Value in this Area
Purchase History
| Date | Buyer | Sale Price | Title Company |
|---|---|---|---|
| Gura Inc | $1,440,000 | -- | |
| Gura Inc | $1,440,000 | -- | |
| Gura Inc | $1,440,000 | -- | |
| Ceci Salvatore | -- | -- | |
| Ceci Salvatore | -- | -- | |
| Ceci Salvatore | -- | -- | |
| Ceci Salvatore | -- | -- | |
| Ceci Vincent | -- | -- | |
| Ceci Vincent | -- | -- | |
| Damato Elizabeth | -- | Chicago Title Insurance Co | |
| Damato Elizabeth | -- | Chicago Title Insurance Co |
Source: Public Records
Mortgage History
| Date | Status | Borrower | Loan Amount |
|---|---|---|---|
| Open | Gura Inc | $750,000 | |
| Closed | Gura Inc | $750,000 |
Source: Public Records
Tax History
| Year | Tax Paid | Tax Assessment Tax Assessment Total Assessment is a certain percentage of the fair market value that is determined by local assessors to be the total taxable value of land and additions on the property. | Land | Improvement |
|---|---|---|---|---|
| 2025 | $12,986 | $94,980 | $19,500 | $75,480 |
| 2024 | $12,986 | $94,680 | $19,500 | $75,180 |
| 2023 | $12,464 | $106,800 | $19,500 | $87,300 |
| 2022 | $12,252 | $96,300 | $19,500 | $76,800 |
| 2021 | $12,396 | $94,560 | $19,500 | $75,060 |
| 2020 | $5,189 | $87,960 | $19,500 | $68,460 |
| 2019 | $10,115 | $70,140 | $19,500 | $50,640 |
| 2018 | $9,299 | $45,619 | $12,459 | $33,160 |
| 2017 | $9,299 | $45,619 | $18,839 | $26,780 |
| 2016 | $8,533 | $43,560 | $16,087 | $27,473 |
| 2015 | $5,088 | $41,332 | $17,912 | $23,420 |
| 2014 | $5,088 | $40,296 | $18,138 | $22,158 |
Source: Public Records
Map
Nearby Homes
Your Personal Tour Guide
Ask me questions while you tour the home.