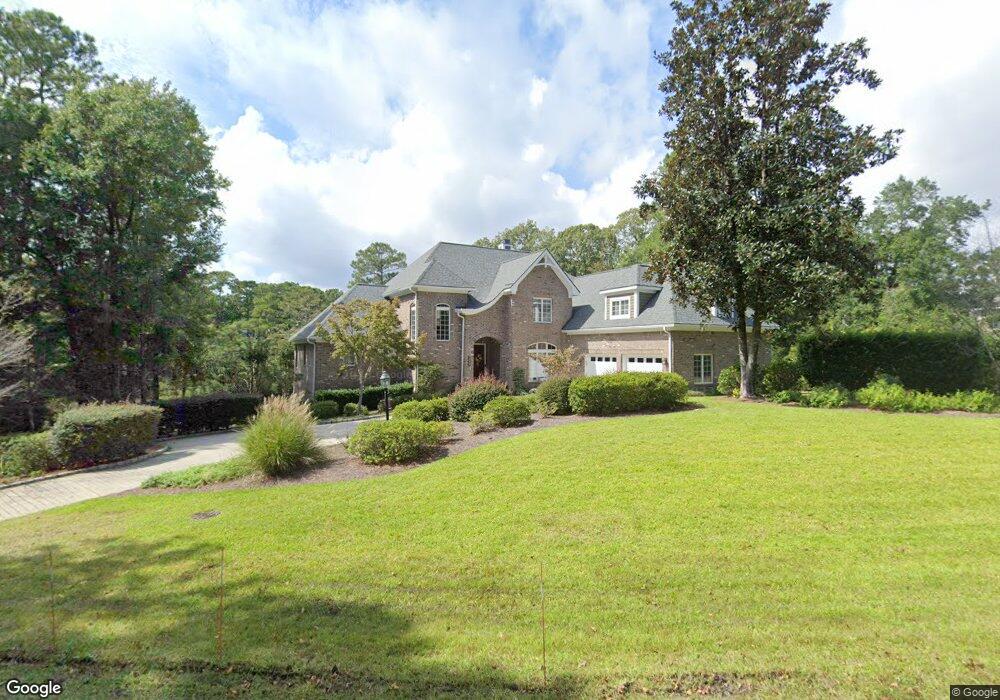
1225 Futch Creek Rd Wilmington, NC 28411
Estimated Value: $935,415 - $1,055,000
3
Beds
4
Baths
3,405
Sq Ft
$289/Sq Ft
Est. Value
About This Home
This home is located at 1225 Futch Creek Rd, Wilmington, NC 28411 and is currently estimated at $982,854, approximately $288 per square foot. 1225 Futch Creek Rd is a home located in New Hanover County with nearby schools including Porters Neck Elementary School, Holly Shelter Middle School, and Emsley A. Laney High School.
Ownership History
Date
Name
Owned For
Owner Type
Purchase Details
Closed on
Mar 31, 2011
Sold by
Mcnally Ronald E and Mcnally Rosemarie A
Bought by
Mcnally Ronald E and The Ronald E Mcnally Revocable
Current Estimated Value
Purchase Details
Closed on
Jan 20, 2011
Sold by
Mcnally Ronald E and The Ronald E Mcnally Revocable
Bought by
Mcnally Ronald E and Mcnally Rosemarie A
Purchase Details
Closed on
Apr 28, 2010
Sold by
Mcnally Ronald E and Mcnally Rsemarie A
Bought by
Mcnally Ronald E and Mcnally Rsemarie A
Purchase Details
Closed on
Dec 23, 2003
Sold by
Gordon Robin Castrovinci Joel
Bought by
Mcnally Ronald E Rosemarie A
Purchase Details
Closed on
Jan 14, 1989
Sold by
Castrovinci Robin
Bought by
Gordon Robin Castrovinci
Purchase Details
Closed on
May 1, 1988
Sold by
Porters Neck Associates
Bought by
Castrovinci Robin
Purchase Details
Closed on
Aug 1, 1987
Bought by
Porters Neck Associates
Create a Home Valuation Report for This Property
The Home Valuation Report is an in-depth analysis detailing your home's value as well as a comparison with similar homes in the area
Home Values in the Area
Average Home Value in this Area
Purchase History
| Date | Buyer | Sale Price | Title Company |
|---|---|---|---|
| Mcnally Ronald E | -- | None Available | |
| Mcnally Ronald E | -- | None Available | |
| Mcnally Ronald E | -- | None Available | |
| Mcnally Ronald E Rosemarie A | $102,000 | -- | |
| Gordon Robin Castrovinci | -- | -- | |
| Castrovinci Robin | $34,500 | -- | |
| Porters Neck Associates | -- | -- |
Source: Public Records
Tax History Compared to Growth
Tax History
| Year | Tax Paid | Tax Assessment Tax Assessment Total Assessment is a certain percentage of the fair market value that is determined by local assessors to be the total taxable value of land and additions on the property. | Land | Improvement |
|---|---|---|---|---|
| 2025 | -- | $844,100 | $257,700 | $586,400 |
| 2023 | -- | $590,500 | $171,800 | $418,700 |
| 2022 | $0 | $590,500 | $171,800 | $418,700 |
| 2021 | $3,546 | $590,500 | $171,800 | $418,700 |
| 2020 | $3,546 | $560,700 | $185,900 | $374,800 |
| 2019 | $3,546 | $560,700 | $185,900 | $374,800 |
| 2018 | $3,546 | $560,700 | $185,900 | $374,800 |
| 2017 | $4,026 | $621,800 | $185,900 | $435,900 |
| 2016 | $3,276 | $472,700 | $117,100 | $355,600 |
| 2015 | $3,044 | $472,700 | $117,100 | $355,600 |
| 2014 | $2,992 | $472,700 | $117,100 | $355,600 |
Source: Public Records
Map
Nearby Homes
- 8702 Thornblade Cir
- 1117 Futch Creek Rd
- 8700 Fazio Dr
- 571 Windstar Ln
- 1012 Creekside Ln
- 527 Windstar Ln
- 8500 Hammock Dunes Dr
- 604 Wild Dunes Cir
- 8509 Galloway National Dr
- 8709 Decoy Ln
- 8948 Woodcreek Cir
- 8425 Ventana Dr
- 8336 Vintage Club Cir
- 621 Wild Dunes Cir
- 1013 Wild Dunes Cir
- 424 Black Diamond Dr
- 720 Wild Dunes Cir
- 8707 Lowes Island Dr
- 1006 Butler National Ln
- 8808 Nadie Ln
- 1301 Futch Creek Rd
- 8640 Vintage Club Dr
- 8644 Vintage Club Dr
- 8636 Vintage Club Dr
- 8704 Thornblade Cir
- 8648 Vintage Club Dr
- 8709 Lake Nona Dr
- 1307 Futch Creek Rd
- 8633 Vintage Club Dr
- 1201 Futch Creek Rd
- 8637 Vintage Club Dr
- 8709 Thornblade Cir
- 8705 Lake Nona Dr
- 8652 Vintage Club Dr
- 8712 Lake Nona Dr Unit 49R
- 1133 Futch Creek Rd
- 8641 Vintage Club Dr
- 8705 Thornblade Cir
- 8641 Vintage Club
- 8707 Thornblade Cir