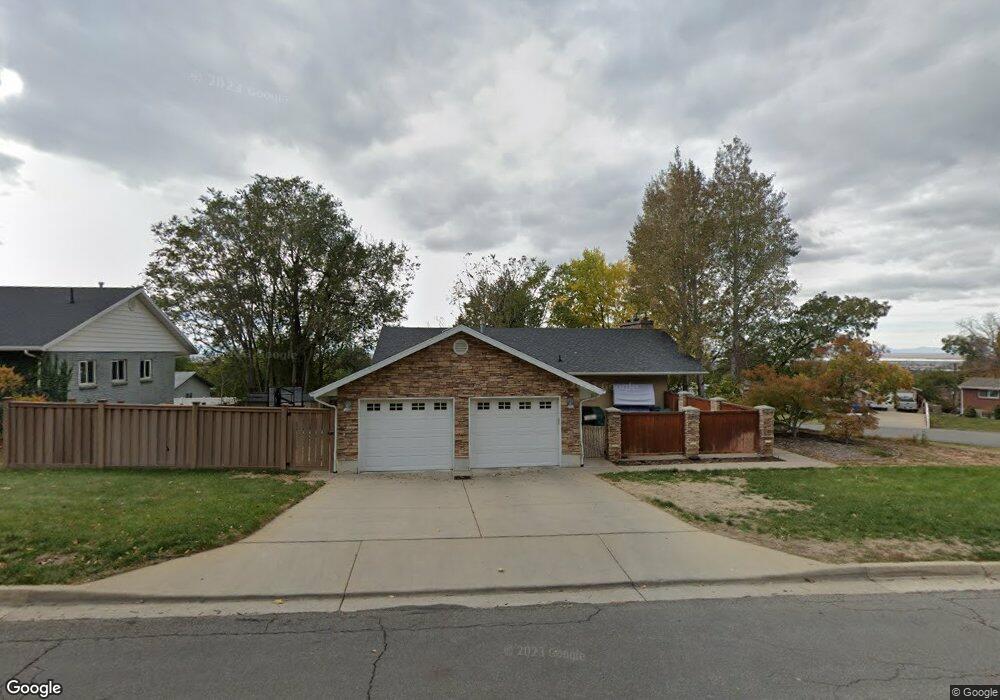
1225 N 850 E Bountiful, UT 84010
Estimated Value: $544,000 - $655,000
4
Beds
3
Baths
2,521
Sq Ft
$239/Sq Ft
Est. Value
About This Home
This home is located at 1225 N 850 E, Bountiful, UT 84010 and is currently estimated at $602,819, approximately $239 per square foot. 1225 N 850 E is a home located in Davis County with nearby schools including Tolman School, Centerville Jr High, and Viewmont High School.
Ownership History
Date
Name
Owned For
Owner Type
Purchase Details
Closed on
Apr 3, 2020
Sold by
Bell Aaron
Bought by
Bell Deborah C
Current Estimated Value
Home Financials for this Owner
Home Financials are based on the most recent Mortgage that was taken out on this home.
Original Mortgage
$130,000
Outstanding Balance
$114,914
Interest Rate
3.4%
Mortgage Type
Credit Line Revolving
Estimated Equity
$487,905
Purchase Details
Closed on
Apr 11, 2006
Sold by
Bell Deborah C
Bought by
Bell Aaron and Bell Deborah C
Purchase Details
Closed on
May 3, 2005
Sold by
Aller Matthew J and Aller Teresa H
Bought by
Bell Deborah C
Create a Home Valuation Report for This Property
The Home Valuation Report is an in-depth analysis detailing your home's value as well as a comparison with similar homes in the area
Purchase History
| Date | Buyer | Sale Price | Title Company |
|---|---|---|---|
| Bell Deborah C | -- | Inwest Title Servic | |
| Bell Aaron | -- | Accommodation | |
| Bell Deborah C | -- | Aspen Title Ins Agency |
Source: Public Records
Mortgage History
| Date | Status | Borrower | Loan Amount |
|---|---|---|---|
| Open | Bell Deborah C | $130,000 |
Source: Public Records
Tax History
| Year | Tax Paid | Tax Assessment Tax Assessment Total Assessment is a certain percentage of the fair market value that is determined by local assessors to be the total taxable value of land and additions on the property. | Land | Improvement |
|---|---|---|---|---|
| 2025 | $3,348 | $306,900 | $120,536 | $186,364 |
| 2024 | $3,163 | $300,300 | $111,234 | $189,066 |
| 2023 | $3,153 | $544,000 | $200,383 | $343,617 |
| 2022 | $3,341 | $316,800 | $106,521 | $210,279 |
| 2021 | $2,693 | $388,000 | $158,210 | $229,790 |
| 2020 | $2,367 | $342,000 | $144,088 | $197,912 |
| 2019 | $2,348 | $331,000 | $144,853 | $186,147 |
| 2018 | $2,205 | $306,000 | $134,160 | $171,840 |
| 2016 | $1,967 | $148,115 | $41,670 | $106,445 |
| 2015 | $1,972 | $140,415 | $41,670 | $98,745 |
| 2014 | $1,915 | $140,133 | $41,670 | $98,463 |
| 2013 | -- | $119,411 | $41,748 | $77,663 |
Source: Public Records
Map
Nearby Homes
- 908 Northern Hills Dr Unit 3
- 933 Northern Hills Cir
- 214 E 1250 N
- 610 S 800 E
- 978 N 170 E
- 513 N 400 E Unit 14B
- 967 S Courtyard Ln
- 453 N 400 E Unit 7-D
- 1420 N Main St
- 207 E 820 S
- 495 E 475 S
- 129 N 800 E
- 683 E 100 N
- 150 E 735 S Unit 23
- 1342 E Skyline Dr N Unit 30
- 6 N 800 E
- 16 W 780 S
- 17 E 400 N Unit 19B
- 328 E 1100 S
- 106 W 700 N
Your Personal Tour Guide
Ask me questions while you tour the home.