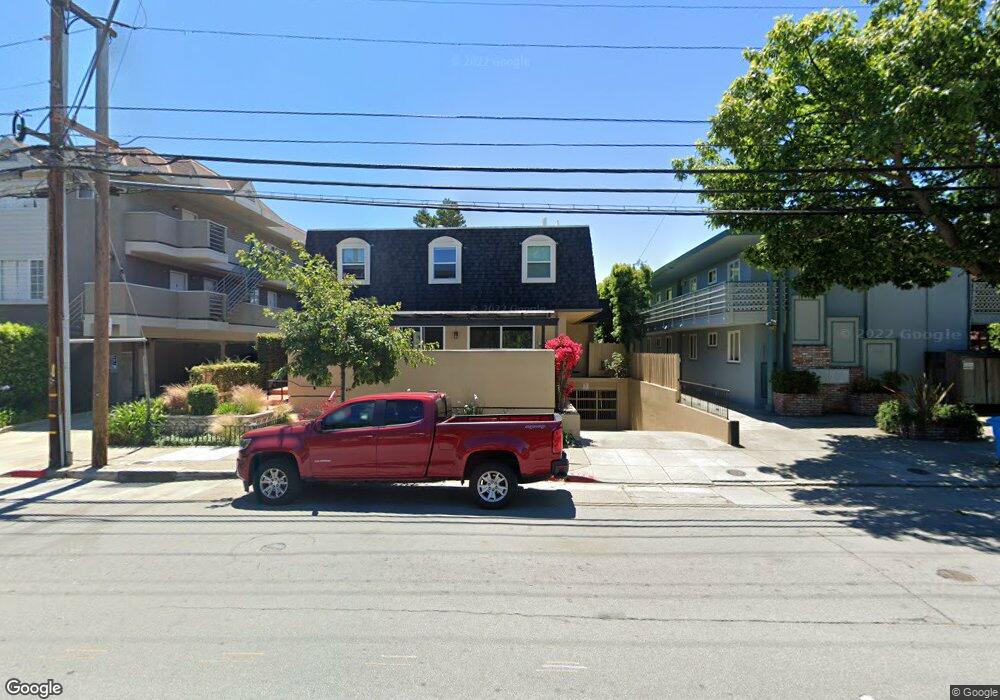
1225 Oak Grove Ave Burlingame, CA 94010
Downtown Burlingame NeighborhoodEstimated Value: $1,522,000 - $1,954,000
2
Beds
3
Baths
1,814
Sq Ft
$914/Sq Ft
Est. Value
About This Home
This home is located at 1225 Oak Grove Ave, Burlingame, CA 94010 and is currently estimated at $1,657,479, approximately $913 per square foot. 1225 Oak Grove Ave is a home located in San Mateo County with nearby schools including McKinley Elementary School, Burlingame Intermediate School, and Burlingame High School.
Ownership History
Date
Name
Owned For
Owner Type
Purchase Details
Closed on
Oct 23, 2018
Sold by
Baca Steven and Baca Robert
Bought by
Wu Hsiang Li and Chu Liang Yuan
Current Estimated Value
Home Financials for this Owner
Home Financials are based on the most recent Mortgage that was taken out on this home.
Original Mortgage
$1,198,400
Outstanding Balance
$1,025,328
Interest Rate
3.75%
Mortgage Type
Adjustable Rate Mortgage/ARM
Estimated Equity
$632,151
Purchase Details
Closed on
Sep 9, 2014
Sold by
Baca Steven
Bought by
Baca James
Purchase Details
Closed on
Jun 21, 2012
Sold by
Baca Robert D
Bought by
Baca Robert D
Purchase Details
Closed on
Jul 1, 2010
Sold by
Baca Nuccia
Bought by
Baca Nuccia
Create a Home Valuation Report for This Property
The Home Valuation Report is an in-depth analysis detailing your home's value as well as a comparison with similar homes in the area
Home Values in the Area
Average Home Value in this Area
Purchase History
| Date | Buyer | Sale Price | Title Company |
|---|---|---|---|
| Wu Hsiang Li | $1,498,000 | Old Republic Title Co | |
| Baca James | -- | None Available | |
| Baca Dana | -- | None Available | |
| Baca Robert | -- | None Available | |
| Baca Steven | -- | None Available | |
| Baca Robert D | -- | None Available | |
| Baca Nuccia | -- | None Available |
Source: Public Records
Mortgage History
| Date | Status | Borrower | Loan Amount |
|---|---|---|---|
| Open | Wu Hsiang Li | $1,198,400 |
Source: Public Records
Tax History Compared to Growth
Tax History
| Year | Tax Paid | Tax Assessment Tax Assessment Total Assessment is a certain percentage of the fair market value that is determined by local assessors to be the total taxable value of land and additions on the property. | Land | Improvement |
|---|---|---|---|---|
| 2025 | $18,640 | $1,671,041 | $500,865 | $1,170,176 |
| 2023 | $18,640 | $1,606,155 | $481,417 | $1,124,738 |
| 2022 | $17,980 | $1,574,663 | $471,978 | $1,102,685 |
| 2021 | $18,007 | $1,543,788 | $462,724 | $1,081,064 |
| 2020 | $17,636 | $1,527,960 | $457,980 | $1,069,980 |
| 2019 | $17,243 | $1,498,000 | $449,000 | $1,049,000 |
| 2018 | $5,118 | $423,444 | $100,430 | $323,014 |
| 2017 | $5,081 | $415,144 | $98,462 | $316,682 |
| 2016 | $4,894 | $407,006 | $96,532 | $310,474 |
| 2015 | $4,873 | $400,895 | $95,083 | $305,812 |
| 2014 | $3,634 | $297,407 | $59,472 | $237,935 |
Source: Public Records
Map
Nearby Homes
- 712 Crossway Rd
- 1427 Floribunda Ave Unit 304
- 1433 Floribunda Ave Unit 5
- 1433 Floribunda Ave Unit 7
- 1433 Floribunda Ave Unit 2
- 1433 Floribunda Ave Unit 1
- 1133 Douglas Ave Unit 3
- 1121 Douglas Ave Unit 201
- 737 Linden Ave
- 1515 Floribunda Ave Unit 309
- 1515 Floribunda Ave Unit 302
- 732 Paloma Ave
- 550 El Camino Real Unit 302
- 1030 Morrell Ave
- 735 El Camino Real Unit 104
- 777 Morrell Ave Unit 302
- 824 El Camino Real
- 900 Toyon Dr
- 733 Lexington Way
- 680 Fairway Cir
- 1225 Oak Grove Ave Unit 1
- 1225 Oak Grove Ave Unit 6
- 1225 Oak Grove Ave Unit 4
- 1225 Oak Grove Ave
- 1225 Oak Grove Ave
- 1225 Oak Grove Ave
- 1225 Oak Grove Ave
- 1225 Oak Grove Ave Unit 3
- 1235 Oak Grove Ave
- 1209 Oak Grove Ave Unit 202
- 1209 Oak Grove Ave Unit 205
- 1209 Oak Grove Ave Unit 203
- 1209 Oak Grove Ave Unit 204
- 1209 Oak Grove Ave Unit 305
- 1209 Oak Grove Ave
- 1209 Oak Grove Ave Unit 301
- 1209 Oak Grove Ave
- 1209 Oak Grove Ave
- 1209 Oak Grove Ave Unit 304
- 1209 Oak Grove Ave Unit 302