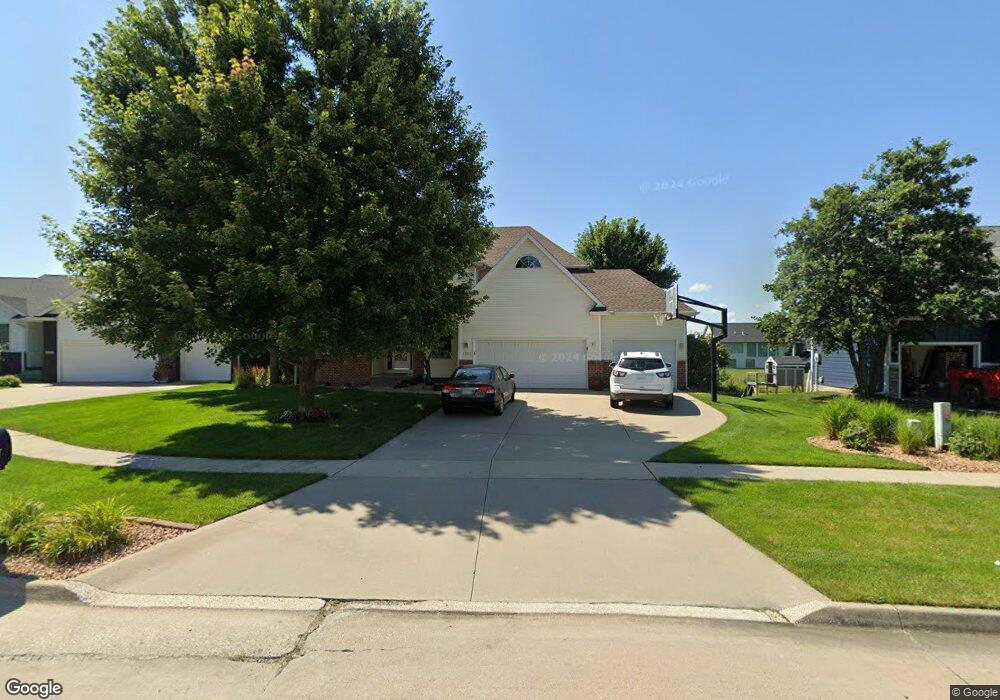
1225 Scenic Cir West Des Moines, IA 50265
Estimated Value: $564,000 - $644,000
5
Beds
5
Baths
2,551
Sq Ft
$239/Sq Ft
Est. Value
About This Home
This home is located at 1225 Scenic Cir, West Des Moines, IA 50265 and is currently estimated at $610,152, approximately $239 per square foot. 1225 Scenic Cir is a home located in Polk County with nearby schools including Jordan Creek Elementary School, Valley Southwoods Freshman High School, and Stilwell Junior High School.
Ownership History
Date
Name
Owned For
Owner Type
Purchase Details
Closed on
Sep 9, 2011
Sold by
Heathman Susan Kay
Bought by
Cataldo Marc T and Cataldo Natalie E
Current Estimated Value
Home Financials for this Owner
Home Financials are based on the most recent Mortgage that was taken out on this home.
Original Mortgage
$338,983
Outstanding Balance
$234,926
Interest Rate
4.59%
Estimated Equity
$375,226
Purchase Details
Closed on
May 28, 2003
Sold by
Lynn Ross Homes Inc
Bought by
Heathman Troy and Heathman Susie
Home Financials for this Owner
Home Financials are based on the most recent Mortgage that was taken out on this home.
Original Mortgage
$200,000
Interest Rate
5.78%
Purchase Details
Closed on
Aug 8, 2001
Sold by
Scenic Meadows Lc
Bought by
Lynn Ross Homes Inc
Home Financials for this Owner
Home Financials are based on the most recent Mortgage that was taken out on this home.
Original Mortgage
$145,000
Interest Rate
7.23%
Create a Home Valuation Report for This Property
The Home Valuation Report is an in-depth analysis detailing your home's value as well as a comparison with similar homes in the area
Home Values in the Area
Average Home Value in this Area
Purchase History
| Date | Buyer | Sale Price | Title Company |
|---|---|---|---|
| Cataldo Marc T | $349,500 | None Available | |
| Heathman Troy | $369,500 | -- | |
| Lynn Ross Homes Inc | $47,500 | -- |
Source: Public Records
Mortgage History
| Date | Status | Borrower | Loan Amount |
|---|---|---|---|
| Open | Cataldo Marc T | $338,983 | |
| Previous Owner | Heathman Troy | $200,000 | |
| Previous Owner | Lynn Ross Homes Inc | $145,000 |
Source: Public Records
Tax History Compared to Growth
Tax History
| Year | Tax Paid | Tax Assessment Tax Assessment Total Assessment is a certain percentage of the fair market value that is determined by local assessors to be the total taxable value of land and additions on the property. | Land | Improvement |
|---|---|---|---|---|
| 2025 | $8,778 | $619,800 | $129,100 | $490,700 |
| 2024 | $8,778 | $564,300 | $115,200 | $449,100 |
| 2023 | $8,718 | $564,300 | $115,200 | $449,100 |
| 2022 | $8,614 | $460,400 | $97,300 | $363,100 |
| 2021 | $8,464 | $460,400 | $97,300 | $363,100 |
| 2020 | $8,332 | $430,600 | $90,900 | $339,700 |
| 2019 | $8,268 | $430,600 | $90,900 | $339,700 |
| 2018 | $8,282 | $412,100 | $85,500 | $326,600 |
| 2017 | $7,958 | $412,100 | $85,500 | $326,600 |
| 2016 | $7,782 | $385,000 | $73,200 | $311,800 |
| 2015 | $7,782 | $385,000 | $73,200 | $311,800 |
| 2014 | $6,912 | $349,700 | $65,200 | $284,500 |
Source: Public Records
Map
Nearby Homes
- 3442 Glenwood Dr
- 3444 Valley View Dr
- 1607 Thornwood Rd
- 708 S 25th Ct
- 2405 Heatherwood Dr
- 2536 SE Morningdew Dr
- 1738 S 40th Ct
- 5500 Grand Ave
- 501 S 33rd St
- 3700 Hidden Creek Dr
- 4205 Quail Ct
- 485 S 19th St
- 2253 Grand Ave Unit 8
- 2247 Grand Ave Unit 12
- 2247 Grand Ave Unit 2
- 4620 Park Dr
- 1683 S 49th St
- 4848 Oakwood Ln
- 205 S 29th St
- 1725 S 50th St Unit 704
- 1221 Scenic Cir
- 1229 Scenic Cir
- 1217 Scenic Cir
- 1233 Scenic Cir
- 1224 Scenic Cir
- 1228 Scenic Cir
- 3083 Valley View Dr
- 1212 Scenic Cir
- 3161 Valley View Dr
- 1232 Scenic Cir
- 1213 Scenic Cir
- 3285 Valley View Dr
- 2845 Valley View Dr
- 3309 Valley View Dr
- 1209 Scenic Cir
- 3100 Scenic Valley Dr
- 1205 Scenic Cir
- 3000 Scenic Valley Dr
- 3315 Valley View Dr
- 2837 Valley View Dr