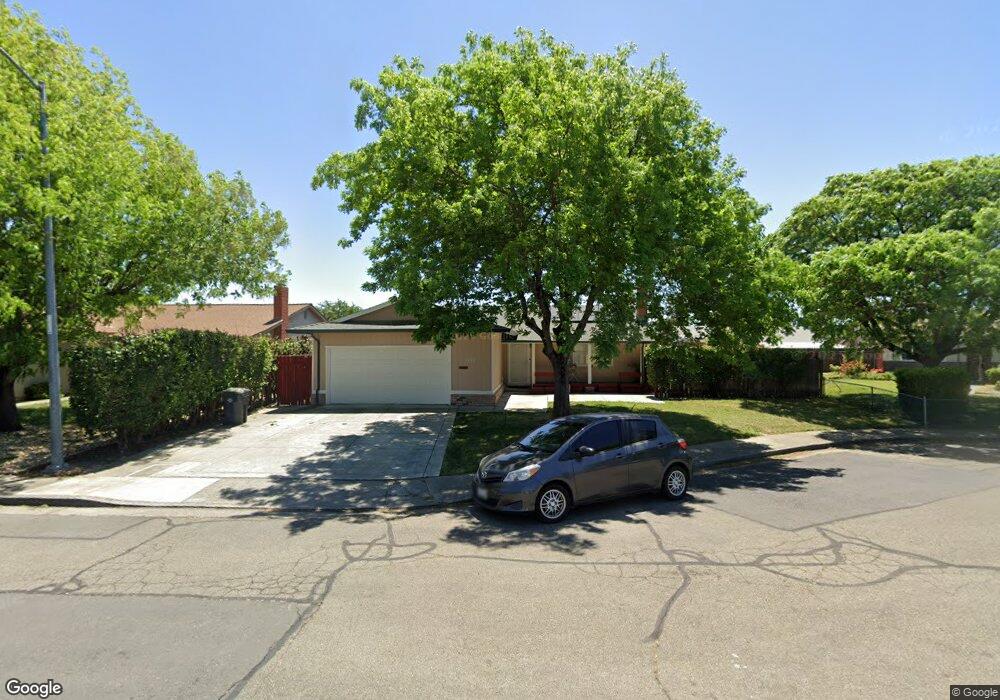
1225 Sprig Ct Fairfield, CA 94533
Estimated Value: $525,000 - $539,000
4
Beds
2
Baths
1,848
Sq Ft
$287/Sq Ft
Est. Value
About This Home
This home is located at 1225 Sprig Ct, Fairfield, CA 94533 and is currently estimated at $530,147, approximately $286 per square foot. 1225 Sprig Ct is a home located in Solano County with nearby schools including Cleo Gordon Elementary School, Grange Middle School, and Fairfield High School.
Ownership History
Date
Name
Owned For
Owner Type
Purchase Details
Closed on
Nov 15, 2007
Sold by
Knuckles Bonita A and Brumfield Bonita A
Bought by
Knuckles Bonita A
Current Estimated Value
Home Financials for this Owner
Home Financials are based on the most recent Mortgage that was taken out on this home.
Original Mortgage
$280,800
Outstanding Balance
$188,599
Interest Rate
7.61%
Mortgage Type
New Conventional
Estimated Equity
$341,548
Purchase Details
Closed on
Mar 20, 1996
Sold by
Garcia Ignacio and Garcia Molly
Bought by
Brumfield Bonita A
Home Financials for this Owner
Home Financials are based on the most recent Mortgage that was taken out on this home.
Original Mortgage
$135,150
Interest Rate
6.98%
Mortgage Type
VA
Purchase Details
Closed on
Mar 16, 1995
Sold by
Garcia Ignacio and Garcia Molly
Bought by
Garcia Ignacio and Garcia Molly
Create a Home Valuation Report for This Property
The Home Valuation Report is an in-depth analysis detailing your home's value as well as a comparison with similar homes in the area
Home Values in the Area
Average Home Value in this Area
Purchase History
| Date | Buyer | Sale Price | Title Company |
|---|---|---|---|
| Knuckles Bonita A | -- | Ticor Title Insurance Co | |
| Brumfield Bonita A | $132,500 | Placer Title Company | |
| Garcia Ignacio | -- | -- |
Source: Public Records
Mortgage History
| Date | Status | Borrower | Loan Amount |
|---|---|---|---|
| Open | Knuckles Bonita A | $280,800 | |
| Closed | Brumfield Bonita A | $135,150 |
Source: Public Records
Tax History
| Year | Tax Paid | Tax Assessment Tax Assessment Total Assessment is a certain percentage of the fair market value that is determined by local assessors to be the total taxable value of land and additions on the property. | Land | Improvement |
|---|---|---|---|---|
| 2025 | $2,476 | $220,116 | $66,449 | $153,667 |
| 2024 | $2,476 | $215,801 | $65,147 | $150,654 |
| 2023 | $2,401 | $211,570 | $63,870 | $147,700 |
| 2022 | $2,372 | $207,422 | $62,618 | $144,804 |
| 2021 | $2,348 | $203,356 | $61,391 | $141,965 |
| 2020 | $2,294 | $201,272 | $60,762 | $140,510 |
| 2019 | $2,238 | $197,326 | $59,571 | $137,755 |
| 2018 | $2,309 | $193,457 | $58,403 | $135,054 |
| 2017 | $2,203 | $189,664 | $57,258 | $132,406 |
| 2016 | $2,182 | $185,946 | $56,136 | $129,810 |
| 2015 | $2,037 | $183,154 | $55,293 | $127,861 |
| 2014 | $2,019 | $179,567 | $54,210 | $125,357 |
Source: Public Records
Map
Nearby Homes
- 1213 Sprig Ct
- 2219 Channing Ct
- 2202 Sandpiper Dr
- 2321 Channing Place
- 2076 Harte Ct
- 2059 Tilden Ct
- 2056 Davis Dr
- 1930 Grande Cir Unit 72
- 1328 Horizon Cir
- 2049 Swan Way
- 1941 Grande Cir Unit 45
- 1941 Grande Cir Unit 48
- 1941 Grande Cir Unit 71
- 1850 Blossom Ave Unit 115
- 1464 Descanso Ln
- 1476 Monument Ln
- 1481 Monument Ln
- 1488 Monument Ln
- 1492 Monument Ln
- 2373 Dawn Way
- 1231 Sprig Ct
- 1219 Sprig Ct
- 1230 Sanderling Dr
- 1238 Sanderling Dr
- 1222 Sanderling Dr
- 1237 Sprig Ct
- 1226 Sprig Ct
- 1246 Sanderling Dr
- 1214 Sanderling Dr
- 1232 Sprig Ct
- 1236 Sanderling Dr
- 1214 Sprig Ct
- 1220 Sprig Ct
- 1238 Sprig Ct
- 2226 Cormorant Dr
- 2214 Cormorant Dr
- 2234 Cormorant Dr
- 2208 Cormorant Dr
- 1227 Sanderling Dr
- 1227 Mallard Ct
Your Personal Tour Guide
Ask me questions while you tour the home.