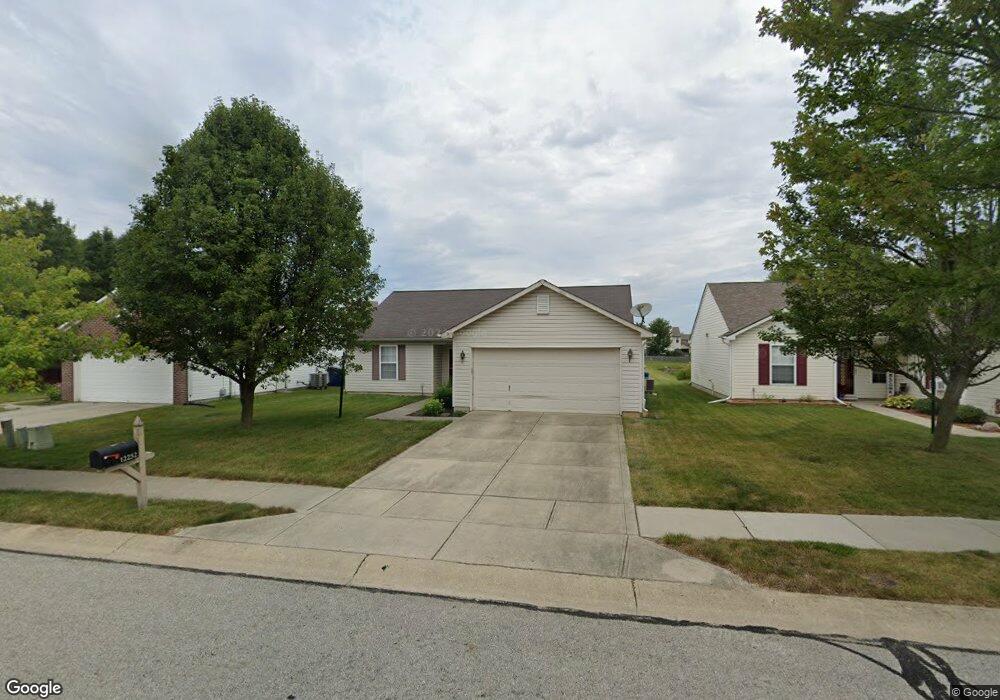
12252 Inside Trail Noblesville, IN 46060
Estimated Value: $274,000 - $318,000
3
Beds
2
Baths
1,316
Sq Ft
$218/Sq Ft
Est. Value
About This Home
This home is located at 12252 Inside Trail, Noblesville, IN 46060 and is currently estimated at $286,620, approximately $217 per square foot. 12252 Inside Trail is a home located in Hamilton County with nearby schools including Durbin Elementary School, Sand Creek Intermediate School, and Fishers Junior High School.
Ownership History
Date
Name
Owned For
Owner Type
Purchase Details
Closed on
Oct 15, 2010
Sold by
Scenna Christine E
Bought by
Blackburn Rickie D
Current Estimated Value
Home Financials for this Owner
Home Financials are based on the most recent Mortgage that was taken out on this home.
Original Mortgage
$98,671
Outstanding Balance
$68,811
Interest Rate
5.5%
Mortgage Type
FHA
Estimated Equity
$217,809
Purchase Details
Closed on
Nov 4, 2005
Sold by
Glaser Brenda J
Bought by
Scenna Christine E
Home Financials for this Owner
Home Financials are based on the most recent Mortgage that was taken out on this home.
Original Mortgage
$123,500
Interest Rate
7.85%
Mortgage Type
Fannie Mae Freddie Mac
Purchase Details
Closed on
Feb 25, 2004
Sold by
Crossmann Communities Partnership
Bought by
Glasser Brenda J
Home Financials for this Owner
Home Financials are based on the most recent Mortgage that was taken out on this home.
Original Mortgage
$101,176
Interest Rate
5.74%
Mortgage Type
FHA
Create a Home Valuation Report for This Property
The Home Valuation Report is an in-depth analysis detailing your home's value as well as a comparison with similar homes in the area
Home Values in the Area
Average Home Value in this Area
Purchase History
| Date | Buyer | Sale Price | Title Company |
|---|---|---|---|
| Blackburn Rickie D | -- | None Available | |
| Scenna Christine E | -- | -- | |
| Glasser Brenda J | -- | -- |
Source: Public Records
Mortgage History
| Date | Status | Borrower | Loan Amount |
|---|---|---|---|
| Open | Blackburn Rickie D | $98,671 | |
| Previous Owner | Scenna Christine E | $123,500 | |
| Previous Owner | Glasser Brenda J | $101,176 |
Source: Public Records
Tax History Compared to Growth
Tax History
| Year | Tax Paid | Tax Assessment Tax Assessment Total Assessment is a certain percentage of the fair market value that is determined by local assessors to be the total taxable value of land and additions on the property. | Land | Improvement |
|---|---|---|---|---|
| 2024 | $2,579 | $223,200 | $86,100 | $137,100 |
| 2023 | $2,614 | $226,700 | $86,100 | $140,600 |
| 2022 | $2,321 | $196,600 | $46,200 | $150,400 |
| 2021 | $1,923 | $162,700 | $46,200 | $116,500 |
| 2020 | $1,778 | $150,500 | $46,200 | $104,300 |
| 2019 | $1,683 | $142,800 | $20,700 | $122,100 |
| 2018 | $1,489 | $132,100 | $20,700 | $111,400 |
| 2017 | $1,290 | $120,900 | $20,700 | $100,200 |
| 2016 | $1,281 | $119,100 | $20,700 | $98,400 |
| 2014 | $1,210 | $118,000 | $20,700 | $97,300 |
| 2013 | $1,210 | $109,300 | $20,700 | $88,600 |
Source: Public Records
Map
Nearby Homes
- 15314 Dusty Trail
- 15296 Wolf Run Ct
- 12314 Medford Place
- 15675 Wescott Dr
- 15752 Matthews Ln
- 15225 Fallen Leaves Ln
- 15283 Follow Dr
- 11925 Sapling Cir
- 15182 Fallen Leaves Ln
- 11886 Locus Ln
- 12645 Cold Stream Rd
- 12705 Old Pond Rd
- 15065 Fawn Hollow Ln
- 15707 Harvester Cir E
- 15737 Harvester Cir E
- 11730 Harvester Cir S
- 12646 Pinetop Way
- 12591 Cattle Ridge Dr
- 12595 Cattle Ridge Dr
- 12603 Cattle Ridge Dr
- 12242 Inside Trail
- 12272 Inside Trail
- 12232 Inside Trail
- 12245 Outside Trail Ct
- 12255 Outside Trail Ct
- 12282 Inside Trail
- 12257 Inside Trail
- 12222 Inside Trail
- 12247 Inside Trail
- 12267 Inside Trail
- 12237 Inside Trail
- 12235 Outside Trail Ct
- 12292 Inside Trail
- 12212 Inside Trail
- 12287 Inside Trail
- 12225 Outside Trail Ct
- 12256 Outside Trail Ct
- 12217 Inside Trail
- 12302 Inside Trail
- 12202 Inside Trail