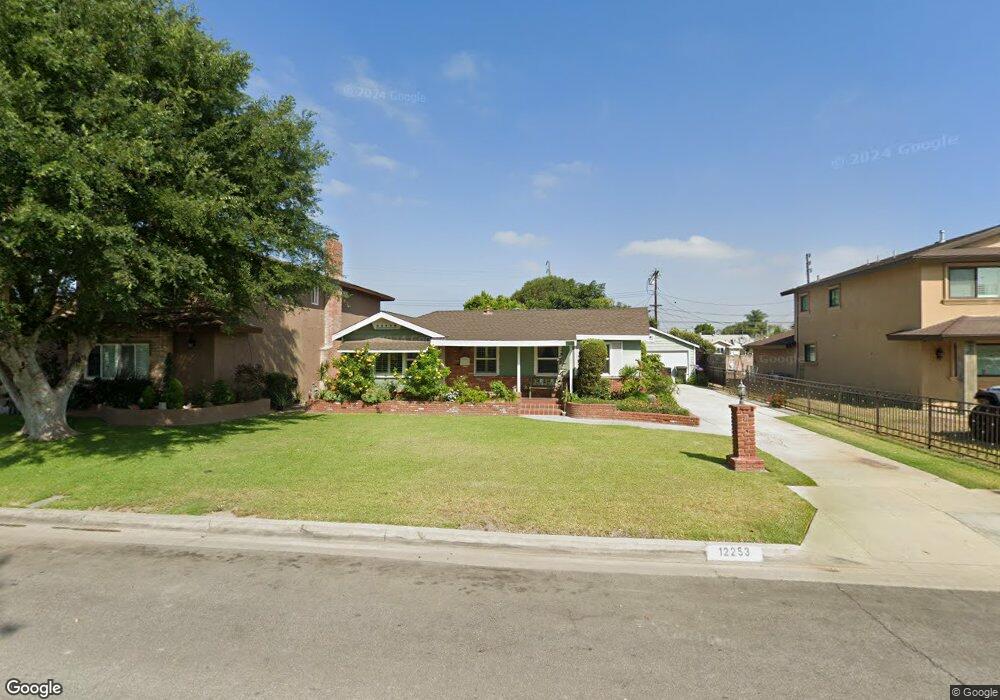
12253 Glynn Ave Downey, CA 90242
Estimated Value: $845,483 - $1,097,000
4
Beds
2
Baths
1,680
Sq Ft
$551/Sq Ft
Est. Value
About This Home
This home is located at 12253 Glynn Ave, Downey, CA 90242 and is currently estimated at $925,121, approximately $550 per square foot. 12253 Glynn Ave is a home located in Los Angeles County with nearby schools including Alameda Elementary School, Carpenter Elementary School, and Sussman Middle School.
Ownership History
Date
Name
Owned For
Owner Type
Purchase Details
Closed on
Jul 1, 2019
Sold by
Esquitin Miguel and Esquitin Jennifer J
Bought by
Esquitin Miguel and Esquitin Jennifer
Current Estimated Value
Home Financials for this Owner
Home Financials are based on the most recent Mortgage that was taken out on this home.
Original Mortgage
$386,500
Outstanding Balance
$339,139
Interest Rate
4%
Mortgage Type
New Conventional
Estimated Equity
$585,982
Purchase Details
Closed on
May 18, 2005
Sold by
Esquitin Miguel and Esquitin Jennifer
Bought by
Esquitin Miguel and Esquitin Jennifer
Purchase Details
Closed on
Jun 19, 2002
Sold by
Mcclurg Craig W and The Eileen Mcclurg Living Trus
Bought by
Esquitin Miguel and Esquitin Jennifer
Home Financials for this Owner
Home Financials are based on the most recent Mortgage that was taken out on this home.
Original Mortgage
$224,000
Interest Rate
6.6%
Create a Home Valuation Report for This Property
The Home Valuation Report is an in-depth analysis detailing your home's value as well as a comparison with similar homes in the area
Home Values in the Area
Average Home Value in this Area
Purchase History
| Date | Buyer | Sale Price | Title Company |
|---|---|---|---|
| Esquitin Miguel | -- | Provident Title Company | |
| Esquitin Miguel | -- | Provident Title Company | |
| Esquitin Miguel | -- | -- | |
| Esquitin Miguel | $280,000 | South Coast Title |
Source: Public Records
Mortgage History
| Date | Status | Borrower | Loan Amount |
|---|---|---|---|
| Open | Esquitin Miguel | $386,500 | |
| Closed | Esquitin Miguel | $224,000 | |
| Closed | Esquitin Miguel | $42,000 |
Source: Public Records
Tax History Compared to Growth
Tax History
| Year | Tax Paid | Tax Assessment Tax Assessment Total Assessment is a certain percentage of the fair market value that is determined by local assessors to be the total taxable value of land and additions on the property. | Land | Improvement |
|---|---|---|---|---|
| 2025 | $5,226 | $405,515 | $287,197 | $118,318 |
| 2024 | $5,226 | $397,565 | $281,566 | $115,999 |
| 2023 | $5,052 | $389,771 | $276,046 | $113,725 |
| 2022 | $4,804 | $382,130 | $270,634 | $111,496 |
| 2021 | $4,691 | $374,638 | $265,328 | $109,310 |
| 2020 | $4,621 | $370,798 | $262,608 | $108,190 |
| 2019 | $4,571 | $363,528 | $257,459 | $106,069 |
| 2018 | $4,389 | $356,401 | $252,411 | $103,990 |
| 2016 | $4,247 | $342,562 | $242,610 | $99,952 |
| 2015 | $4,186 | $337,417 | $238,966 | $98,451 |
| 2014 | $3,957 | $330,808 | $234,285 | $96,523 |
Source: Public Records
Map
Nearby Homes
- 0 Orange St
- 8426 Orange St
- 12143 Downey Ave
- 12124 Anderberg Ave
- 8558 Alameda St
- 12350 Brock Ave
- 12566 Dolan Ave
- 12566 Brookshire Ave
- 12614 Gneiss Ave
- 12014 Patton Rd
- 12152 Marbel Ave
- 12148 Marbel Ave
- 11816 La Reina Ave
- 7820 Springer St
- 7939 Lyndora St
- 8231 Comolette St
- 12307 Rives Ave
- 12343 Rives Ave
- 8509 Cleta St
- 12066 Horley Ave
- 12249 Glynn Ave
- 12259 Glynn Ave
- 12267 Glynn Ave
- 12248 Downey Ave
- 12254 Downey Ave
- 12240 Downey Ave
- 12236 Downey Ave
- 12254 Glynn Ave
- 12271 Glynn Ave
- 12260 Downey Ave
- 12248 Glynn Ave
- 12233 Glynn Ave
- 12262 Glynn Ave
- 12230 Downey Ave
- 12240 Glynn Ave
- 12206 Downey Ave
- 12266 Downey Ave
- 12268 Glynn Ave
- 12236 Glynn Ave
- 12303 Glynn Ave