12255 N Clauson Trail Rathdrum, ID 83858
Estimated Value: $756,000 - $822,000
3
Beds
2
Baths
1,938
Sq Ft
$405/Sq Ft
Est. Value
About This Home
This home is located at 12255 N Clauson Trail, Rathdrum, ID 83858 and is currently estimated at $784,149, approximately $404 per square foot. 12255 N Clauson Trail is a home located in Kootenai County with nearby schools including Twin Lakes Elementary School, Lakeland Middle School, and Lakeland Senior High School.
Ownership History
Date
Name
Owned For
Owner Type
Purchase Details
Closed on
May 22, 2019
Sold by
Rudd Roger N and Rudd Cynthia L
Bought by
Frear Ronald W and Frear Jacquelyn C
Current Estimated Value
Home Financials for this Owner
Home Financials are based on the most recent Mortgage that was taken out on this home.
Original Mortgage
$295,600
Outstanding Balance
$259,364
Interest Rate
4.1%
Mortgage Type
New Conventional
Estimated Equity
$524,785
Purchase Details
Closed on
Mar 30, 2015
Sold by
Walters Donald C and Walters Cheriynn J
Bought by
Rudd Roger N and Rudd Cynthia L
Home Financials for this Owner
Home Financials are based on the most recent Mortgage that was taken out on this home.
Original Mortgage
$243,655
Interest Rate
3.65%
Mortgage Type
VA
Create a Home Valuation Report for This Property
The Home Valuation Report is an in-depth analysis detailing your home's value as well as a comparison with similar homes in the area
Home Values in the Area
Average Home Value in this Area
Purchase History
| Date | Buyer | Sale Price | Title Company |
|---|---|---|---|
| Frear Ronald W | -- | Titleone Boise | |
| Rudd Roger N | -- | Alliance Title |
Source: Public Records
Mortgage History
| Date | Status | Borrower | Loan Amount |
|---|---|---|---|
| Open | Frear Ronald W | $295,600 | |
| Previous Owner | Rudd Roger N | $243,655 |
Source: Public Records
Tax History Compared to Growth
Tax History
| Year | Tax Paid | Tax Assessment Tax Assessment Total Assessment is a certain percentage of the fair market value that is determined by local assessors to be the total taxable value of land and additions on the property. | Land | Improvement |
|---|---|---|---|---|
| 2025 | $1,760 | $639,357 | $300,417 | $338,940 |
| 2024 | $1,760 | $599,577 | $255,667 | $343,910 |
| 2023 | $1,760 | $623,084 | $265,417 | $357,667 |
| 2022 | $2,246 | $677,398 | $249,167 | $428,231 |
| 2021 | $2,006 | $407,910 | $154,820 | $253,090 |
| 2020 | $2,041 | $347,805 | $128,615 | $219,190 |
| 2019 | $1,862 | $294,155 | $118,615 | $175,540 |
| 2018 | $1,911 | $275,135 | $113,615 | $161,520 |
| 2017 | $1,902 | $259,751 | $103,651 | $156,100 |
| 2016 | $1,531 | $229,580 | $80,410 | $149,170 |
| 2015 | $1,177 | $177,050 | $68,000 | $109,050 |
| 2013 | -- | $170,507 | $69,417 | $101,090 |
Source: Public Records
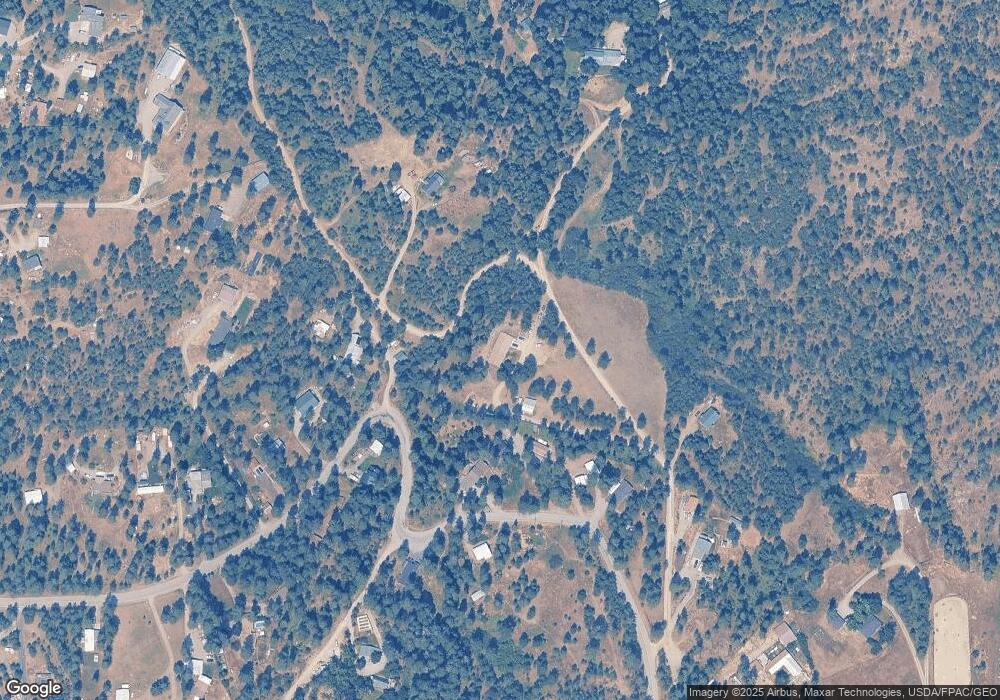
Map
Nearby Homes
- 11583 N Sunrise Ct
- L6B9 N Walden Loop
- L6B10 N Walden Loop
- 12552 N Walden Loop
- L4B10 N Walden Loop
- L6B5 N Spiral Ridge Trail
- Lot13 Blk5 N Spiral Ridge Trail
- L7B5 N Spiral Ridge Trail
- 11248 N Bruss Rd
- L3B10 N Walden Loop
- 11470 N Church Rd
- 13771 N Delta Ln
- 14558 N Saddle Ridge Rd
- 14563 N Saddle Ridge Rd
- NKA N Saddle Ridge Rd
- 9636 N Idaho Rd
- 15077 N Church Rd
- NKA Church Rd
- 10320 N Payment Peak Rd
- 11897 W Hidden Valley Rd
- 12048 N Chase Rd
- 12259 Chase Rd
- 12254 N Chase Rd
- 12313 N Chase Rd
- 12678 N Clauson Trail
- NNA Chase
- 11984 N Chase Rd
- 11984 N Chase Rd
- 12050 Chase Rd N
- 12081 N Chase Rd
- 12286 N Clauson Trail
- 12245 Chase Rd N
- 12234 N Clauson Trail
- 12265 Chase Rd N
- 12127 N Chase Rd
- 12121 N Chase Rd
- 12362 N Chase Rd
- 12300 Chase Rd N
- 12148 N Clauson Trail
- 12398 N Clauson Trail