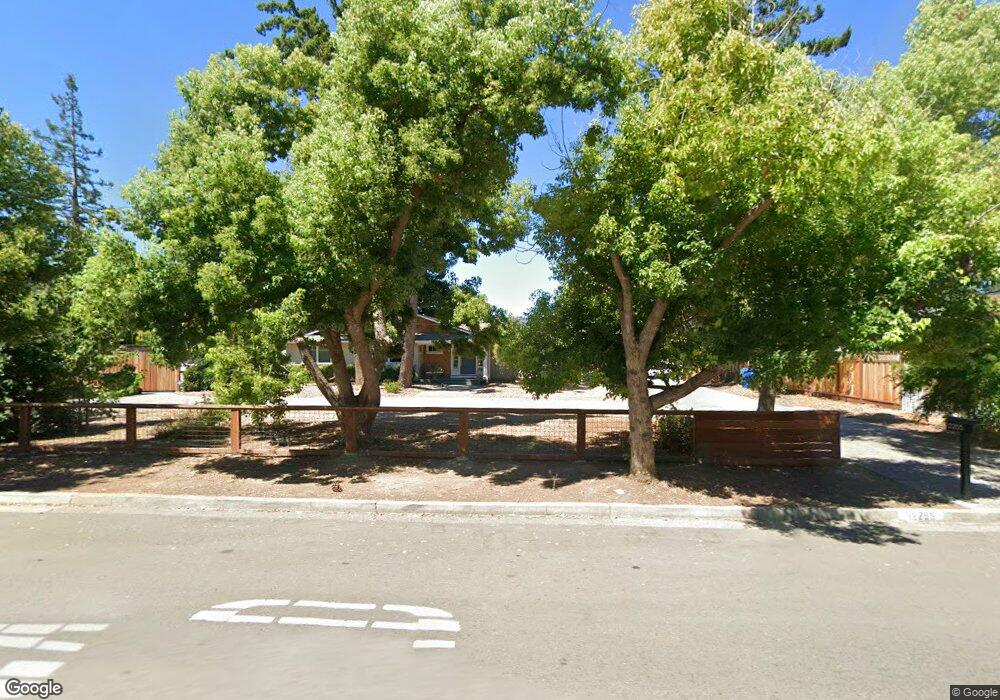
12255 Titus Ave Saratoga, CA 95070
West San Jose NeighborhoodEstimated Value: $3,731,000 - $4,409,000
4
Beds
4
Baths
2,565
Sq Ft
$1,640/Sq Ft
Est. Value
About This Home
This home is located at 12255 Titus Ave, Saratoga, CA 95070 and is currently estimated at $4,207,430, approximately $1,640 per square foot. 12255 Titus Ave is a home located in Santa Clara County with nearby schools including Blue Hills Elementary School, Joaquin Miller Middle, and Lynbrook High School.
Ownership History
Date
Name
Owned For
Owner Type
Purchase Details
Closed on
Apr 20, 2006
Sold by
Kataru Naga Sridhar and Vemula Padmaja
Bought by
Mccormack Richard A and Hedley Janet K
Current Estimated Value
Home Financials for this Owner
Home Financials are based on the most recent Mortgage that was taken out on this home.
Original Mortgage
$442,539
Outstanding Balance
$253,430
Interest Rate
6.3%
Mortgage Type
Credit Line Revolving
Estimated Equity
$3,954,000
Purchase Details
Closed on
Apr 5, 2005
Sold by
Kim Won Sik and Kim Kyung Ja
Bought by
Kataru Nagar Sridhar and Vemula Padmaja
Purchase Details
Closed on
Mar 22, 2000
Sold by
Drake Albert L and Drake Patricia A
Bought by
Kim Won Sik and Kim Kyung Ja
Home Financials for this Owner
Home Financials are based on the most recent Mortgage that was taken out on this home.
Original Mortgage
$1,395,000
Interest Rate
7.62%
Purchase Details
Closed on
Feb 23, 1998
Sold by
Drake Albert L and Drake Patricia A
Bought by
Drake Albert L and Drake Patricia A
Create a Home Valuation Report for This Property
The Home Valuation Report is an in-depth analysis detailing your home's value as well as a comparison with similar homes in the area
Home Values in the Area
Average Home Value in this Area
Purchase History
| Date | Buyer | Sale Price | Title Company |
|---|---|---|---|
| Mccormack Richard A | -- | Old Republic Title Company | |
| Kataru Nagar Sridhar | $1,960,000 | North American Title Company | |
| Kim Won Sik | $1,860,000 | Chicago Title Co | |
| Drake Albert L | -- | -- |
Source: Public Records
Mortgage History
| Date | Status | Borrower | Loan Amount |
|---|---|---|---|
| Open | Mccormack Richard A | $442,539 | |
| Previous Owner | Kim Won Sik | $1,395,000 |
Source: Public Records
Tax History Compared to Growth
Tax History
| Year | Tax Paid | Tax Assessment Tax Assessment Total Assessment is a certain percentage of the fair market value that is determined by local assessors to be the total taxable value of land and additions on the property. | Land | Improvement |
|---|---|---|---|---|
| 2025 | $26,692 | $2,254,353 | $1,981,542 | $272,811 |
| 2024 | $26,692 | $2,210,151 | $1,942,689 | $267,462 |
| 2023 | $26,396 | $2,166,816 | $1,904,598 | $262,218 |
| 2022 | $26,109 | $2,124,330 | $1,867,253 | $257,077 |
| 2021 | $25,831 | $2,082,678 | $1,830,641 | $252,037 |
| 2020 | $25,509 | $2,061,324 | $1,811,871 | $249,453 |
| 2019 | $24,883 | $2,018,946 | $1,776,345 | $242,601 |
| 2018 | $24,290 | $1,979,360 | $1,741,515 | $237,845 |
| 2017 | $24,166 | $1,940,550 | $1,707,368 | $233,182 |
| 2016 | $23,395 | $1,902,501 | $1,673,891 | $228,610 |
| 2015 | $23,222 | $1,873,925 | $1,648,748 | $225,177 |
| 2014 | $22,622 | $1,837,219 | $1,616,452 | $220,767 |
Source: Public Records
Map
Nearby Homes
- 12140 Woodside Dr
- 1681 Danromas Way
- 1587 Miller Ave
- 5635 W Walbrook Dr
- 19920 Viewridge Dr
- 1577 Maurice Ln
- 13010 Glen Brae Dr
- 19423 Vineyard Ln
- 19437 Via Real Dr
- 19113 Vineyard Ln
- 12584 Paseo Flores
- 11010 Maple Place Unit 25-06 Plan 4
- 10750 Elm Cir Unit 88-17 Plan 2
- 11315 Cottonwood Place Unit 39-09 Plan 3
- 10730 Elm Cir Unit 86-17 Plan 2
- Plan 2 at The Elms
- Plan 3 at The Elms
- Plan 4 at The Elms
- 12790 Glen Arbor Ct
- 11210 Cottonwood Place Unit 35-08 Plan 4
- 12239 Titus Ave
- 12235 Titus Ave
- 12206 Melinda Cir
- 12228 Melinda Cir
- 12264 Titus Ave
- 12184 Melinda Cir
- 12257 Titus Ave
- 12240 Melinda Cir
- 12250 Titus Ave
- 12226 Titus Ave
- 12281 Country Squire Ln
- 12279 Titus Ave
- 12308 Titus Ave
- 12221 Melinda Cir
- 19308 Melinda Cir
- 12209 Melinda Cir
- 12198 Titus Ave
- 12187 Melinda Cir
- 12271 Country Squire Ln
- 12280 Country Squire Ln