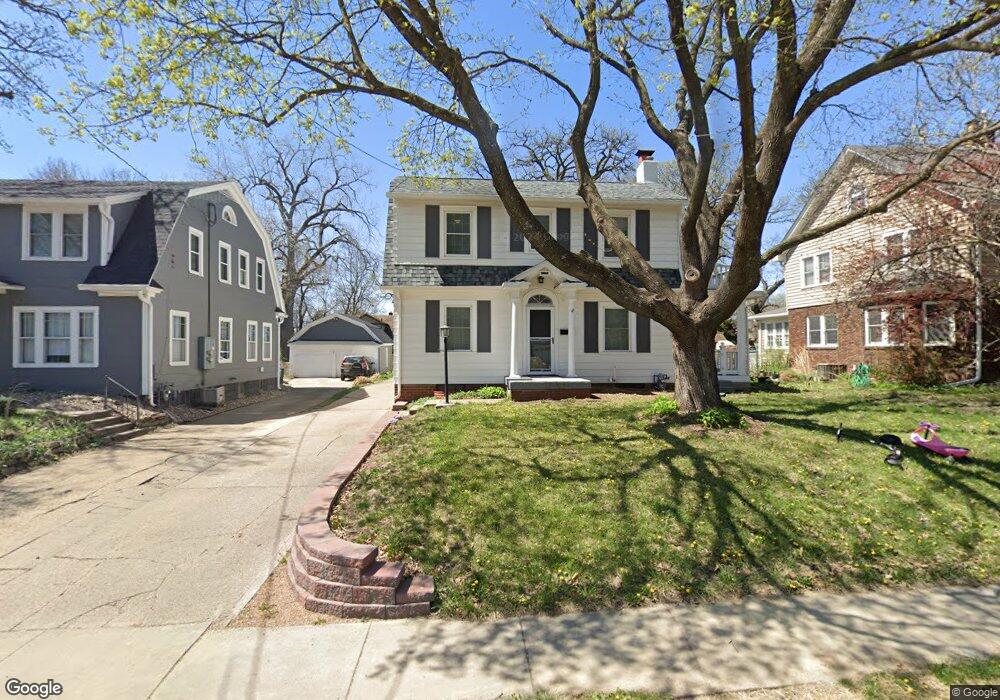
1226 47th St Des Moines, IA 50311
Waveland Park NeighborhoodEstimated Value: $278,000 - $336,000
4
Beds
2
Baths
1,522
Sq Ft
$200/Sq Ft
Est. Value
About This Home
This home is located at 1226 47th St, Des Moines, IA 50311 and is currently estimated at $303,893, approximately $199 per square foot. 1226 47th St is a home located in Polk County with nearby schools including Perkins Elementary School, Merrill Middle School, and Roosevelt High School.
Ownership History
Date
Name
Owned For
Owner Type
Purchase Details
Closed on
Sep 19, 2014
Sold by
Milik Frank William and Milik Jean Carlk
Bought by
Rowland Jeffrey S and Rowland Reilly J
Current Estimated Value
Home Financials for this Owner
Home Financials are based on the most recent Mortgage that was taken out on this home.
Original Mortgage
$173,700
Outstanding Balance
$132,831
Interest Rate
4.11%
Mortgage Type
New Conventional
Estimated Equity
$171,062
Create a Home Valuation Report for This Property
The Home Valuation Report is an in-depth analysis detailing your home's value as well as a comparison with similar homes in the area
Home Values in the Area
Average Home Value in this Area
Purchase History
| Date | Buyer | Sale Price | Title Company |
|---|---|---|---|
| Rowland Jeffrey S | $193,000 | None Available |
Source: Public Records
Mortgage History
| Date | Status | Borrower | Loan Amount |
|---|---|---|---|
| Open | Rowland Jeffrey S | $173,700 |
Source: Public Records
Tax History Compared to Growth
Tax History
| Year | Tax Paid | Tax Assessment Tax Assessment Total Assessment is a certain percentage of the fair market value that is determined by local assessors to be the total taxable value of land and additions on the property. | Land | Improvement |
|---|---|---|---|---|
| 2025 | $4,728 | $281,700 | $48,800 | $232,900 |
| 2024 | $4,728 | $250,800 | $43,200 | $207,600 |
| 2023 | $4,810 | $250,800 | $43,200 | $207,600 |
| 2022 | $4,772 | $213,000 | $38,200 | $174,800 |
| 2021 | $4,596 | $213,000 | $38,200 | $174,800 |
| 2020 | $4,770 | $192,800 | $34,900 | $157,900 |
| 2019 | $4,366 | $192,800 | $34,900 | $157,900 |
| 2018 | $4,318 | $171,000 | $30,500 | $140,500 |
| 2017 | $3,910 | $171,000 | $30,500 | $140,500 |
| 2016 | $3,804 | $153,100 | $27,300 | $125,800 |
| 2015 | $3,804 | $153,100 | $27,300 | $125,800 |
| 2014 | $3,426 | $142,700 | $25,300 | $117,400 |
Source: Public Records
Map
Nearby Homes
- 1310 47th St
- 4902 University Ave Unit 335
- 1314 44th St
- 1415 46th St
- 1347 44th St
- 1055 46th St
- 1021 45th St
- 1544 48th St
- 1541 44th St
- 1503 42nd St
- 4200 Kingman Blvd
- 1541 42nd St
- 4000 University Ave Unit 7
- 1716 47th St
- 4036 Plainview Dr
- 1534 41st St
- 1001 42nd St
- 4303 Crocker St
- 1008 Kingman Cir
- 1529 41st St