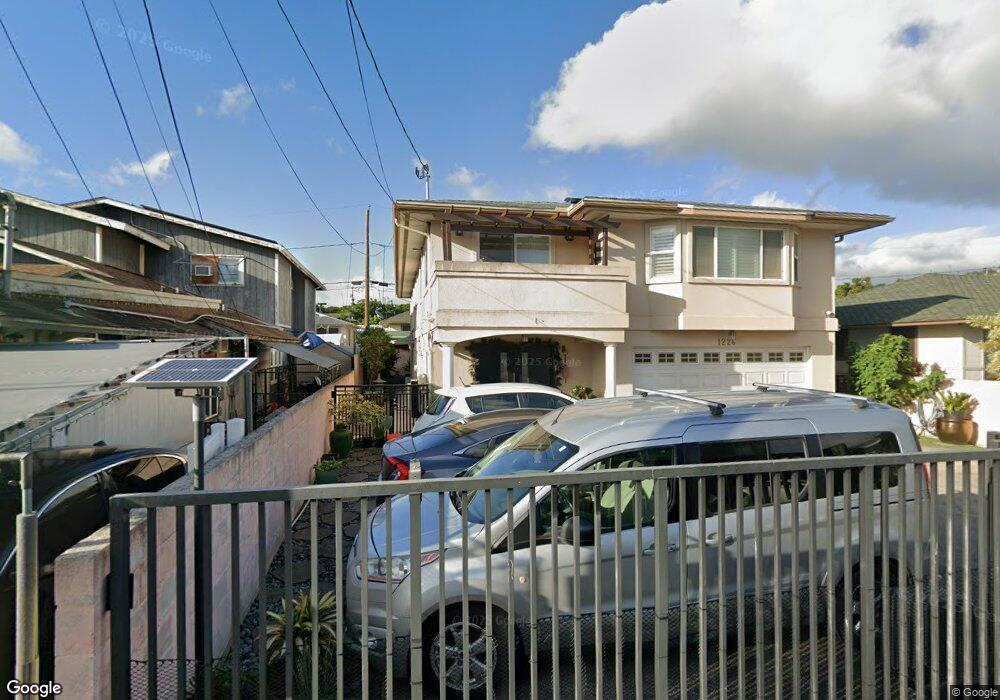
1226 Makalapua Place Honolulu, HI 96817
Liliha-Kapalama NeighborhoodEstimated Value: $1,408,805 - $1,708,000
7
Beds
4
Baths
1,809
Sq Ft
$877/Sq Ft
Est. Value
About This Home
This home is located at 1226 Makalapua Place, Honolulu, HI 96817 and is currently estimated at $1,586,451, approximately $876 per square foot. 1226 Makalapua Place is a home located in Honolulu County with nearby schools including Kapalama Elementary School, King David Kalakaua Middle School, and Gov. Wallace Rider Farrington High School.
Ownership History
Date
Name
Owned For
Owner Type
Purchase Details
Closed on
Sep 3, 2025
Sold by
Jones Timothy Robert and Harada-Jones Jill Aiko
Bought by
Timothy Robert Jones 2024 Trust and Jill Aiko Harada-Jones 2024 Trust
Current Estimated Value
Purchase Details
Closed on
Jun 27, 2013
Sold by
Harada Kikuo
Bought by
Jones Timothy Robert and Harada Jones Jill Aiko
Purchase Details
Closed on
Dec 7, 2010
Sold by
Jones Timothy Robert and Harada Jones Jill Aiko
Bought by
Jones Timothy Robert and Harada Jones Jill Aiko
Home Financials for this Owner
Home Financials are based on the most recent Mortgage that was taken out on this home.
Original Mortgage
$335,000
Interest Rate
4.18%
Mortgage Type
New Conventional
Purchase Details
Closed on
Sep 20, 2005
Sold by
Li Henry Han Xiang
Bought by
Jones Timothy Robert and Harada Jones Jill Aiko
Purchase Details
Closed on
Jan 25, 2005
Sold by
Miyajima Violet Kimiko and Miyajima Violet K
Bought by
Li Henry Han Xiang
Create a Home Valuation Report for This Property
The Home Valuation Report is an in-depth analysis detailing your home's value as well as a comparison with similar homes in the area
Home Values in the Area
Average Home Value in this Area
Purchase History
| Date | Buyer | Sale Price | Title Company |
|---|---|---|---|
| Timothy Robert Jones 2024 Trust | -- | None Listed On Document | |
| Timothy Robert Jones 2024 Trust | -- | None Listed On Document | |
| Jones Timothy Robert | -- | None Available | |
| Jones Timothy Robert | -- | None Available | |
| Jones Timothy Robert | -- | Tg | |
| Jones Timothy Robert | $910,000 | Tg | |
| Li Henry Han Xiang | $320,000 | Title Guaranty |
Source: Public Records
Mortgage History
| Date | Status | Borrower | Loan Amount |
|---|---|---|---|
| Previous Owner | Jones Timothy Robert | $335,000 |
Source: Public Records
Tax History Compared to Growth
Tax History
| Year | Tax Paid | Tax Assessment Tax Assessment Total Assessment is a certain percentage of the fair market value that is determined by local assessors to be the total taxable value of land and additions on the property. | Land | Improvement |
|---|---|---|---|---|
| 2025 | $4,381 | $1,482,500 | $848,200 | $634,300 |
| 2024 | $4,381 | $1,371,600 | $848,200 | $523,400 |
| 2023 | $3,835 | $1,182,300 | $867,100 | $315,200 |
| 2022 | $3,835 | $1,195,800 | $697,400 | $498,400 |
| 2021 | $3,813 | $1,189,500 | $678,600 | $510,900 |
| 2020 | $3,636 | $1,138,800 | $697,400 | $441,400 |
| 2019 | $3,781 | $1,160,200 | $716,300 | $443,900 |
| 2018 | $3,423 | $1,057,900 | $584,300 | $473,600 |
| 2017 | $3,238 | $1,005,000 | $546,600 | $458,400 |
| 2016 | $3,357 | $1,039,200 | $499,500 | $539,700 |
| 2015 | $3,022 | $943,400 | $386,400 | $557,000 |
| 2014 | $2,997 | $890,400 | $377,000 | $513,400 |
Source: Public Records
Map
Nearby Homes
- 1041 Kama Ln
- 1038 Long Ln
- 1325 N School St Unit C323
- 1457 Kokea St
- 1425 Monte Cooke Place
- 1555 Pohaku St Unit B202
- 1555 Pohaku St Unit A408
- 1555 Pohaku St Unit A503
- 1555 Pohaku St Unit A405
- 1209 N School St Unit 102
- 1445 Monte Cooke Place
- 1313 Ahiahi St
- 1031 Morris Ln
- 1628 Aupuni St
- 932 Waiakamilo Rd
- 1119 Kokea St Unit C301
- 1039 Wong Ln
- 1731 Aupuni St Unit 1
- 916 Eu Ln
- 815 Lopez Ln
- 1228 Makalapua Place
- 1220 Makalapua Place
- 1216 Makalapua Place
- 1230 Makalapua Place
- 1228 Halona Place
- 1225 Makalapua Place
- 1234 Halona Place
- 1219 Makalapua Place
- 1229 Makalapua Place
- 1224 Halona Place
- 1218 Halona Place
- 1210 Makalapua Place
- 1215 Makalapua Place
- 1238 Halona Place
- 1233 Makalapua Place
- 1240 Makalapua Place
- 1239 Makalapua Place
- 1330 Halona St
- 1212 Halona Place
- 1211 Makalapua Place