Estimated Value: $215,000 - $246,000
3
Beds
2
Baths
2,045
Sq Ft
$114/Sq Ft
Est. Value
About This Home
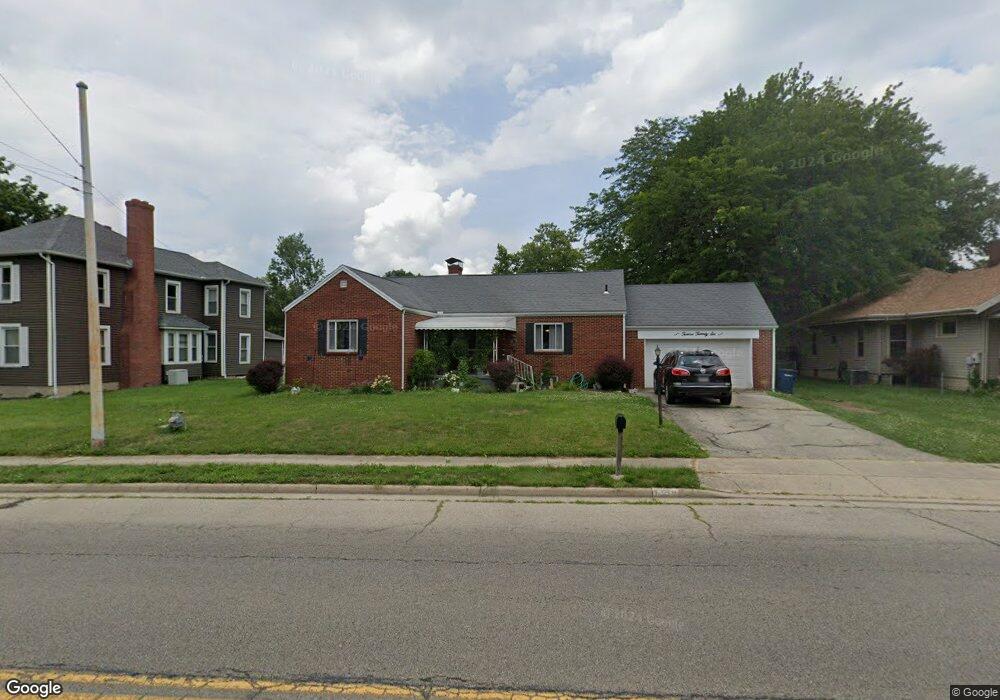
This home is located at 1226 W High St, Piqua, OH 45356 and is currently estimated at $233,113, approximately $113 per square foot. 1226 W High St is a home located in Miami County with nearby schools including Washington Primary School, Piqua Junior High School, and Piqua High School.
Ownership History
Date
Name
Owned For
Owner Type
Purchase Details
Closed on
Jul 27, 2022
Sold by
Bates Julia D
Bought by
Brockman Landon and Brockman Sarah
Current Estimated Value
Purchase Details
Closed on
Mar 16, 2011
Sold by
Secretary Of Housing & Urban Development
Bought by
Burks Derrek P
Purchase Details
Closed on
Oct 1, 2010
Sold by
Wells Fargo Bank Na
Bought by
Secretary Of Housing & Urban Development
Purchase Details
Closed on
Sep 3, 2010
Sold by
Gray Eric
Bought by
Wells Fargo Bank Na
Purchase Details
Closed on
Feb 7, 2006
Sold by
Wheeler Barbara S and Sloan Ann H
Bought by
Gray Eric
Home Financials for this Owner
Home Financials are based on the most recent Mortgage that was taken out on this home.
Original Mortgage
$89,388
Interest Rate
6.37%
Mortgage Type
FHA
Purchase Details
Closed on
Jun 30, 1992
Bought by
Henderson Charles
Create a Home Valuation Report for This Property
The Home Valuation Report is an in-depth analysis detailing your home's value as well as a comparison with similar homes in the area
Home Values in the Area
Average Home Value in this Area
Purchase History
| Date | Buyer | Sale Price | Title Company |
|---|---|---|---|
| Brockman Landon | -- | Mantica Christopher J | |
| Burks Derrek P | -- | -- | |
| Secretary Of Housing & Urban Development | -- | -- | |
| Wells Fargo Bank Na | $58,000 | -- | |
| Gray Eric | $90,430 | -- | |
| Henderson Charles | -- | -- |
Source: Public Records
Mortgage History
| Date | Status | Borrower | Loan Amount |
|---|---|---|---|
| Previous Owner | Gray Eric | $89,388 |
Source: Public Records
Tax History Compared to Growth
Tax History
| Year | Tax Paid | Tax Assessment Tax Assessment Total Assessment is a certain percentage of the fair market value that is determined by local assessors to be the total taxable value of land and additions on the property. | Land | Improvement |
|---|---|---|---|---|
| 2024 | $2,365 | $54,810 | $11,900 | $42,910 |
| 2023 | $2,252 | $54,810 | $11,900 | $42,910 |
| 2022 | $2,292 | $54,810 | $11,900 | $42,910 |
| 2021 | $1,856 | $40,600 | $8,820 | $31,780 |
| 2020 | $1,819 | $40,600 | $8,820 | $31,780 |
| 2019 | $1,829 | $40,600 | $8,820 | $31,780 |
| 2018 | $1,666 | $35,320 | $8,820 | $26,500 |
| 2017 | $1,687 | $35,320 | $8,820 | $26,500 |
| 2016 | $1,668 | $35,320 | $8,820 | $26,500 |
| 2015 | $1,707 | $35,320 | $8,820 | $26,500 |
| 2014 | $1,707 | $35,320 | $8,820 | $26,500 |
| 2013 | $1,762 | $35,320 | $8,820 | $26,500 |
Source: Public Records
Map
Nearby Homes
- 1224 W High St
- 1230 W High St
- 1222 W High St
- 301 Ron Aire Dr
- 1220 W High St
- 1229 W High St
- 1231 W High St
- 303 Ron Aire Dr
- 1218 W High St
- 1227 W High St
- 302 Short Dr
- 1225 W High St
- 1234 W High St
- 305 Ron Aire Dr
- 300 Ron Aire Dr
- 304 Short Dr
- 1233 W High St
- 302 Ron Aire Dr
- 1211 W High St
- 1204 W High St