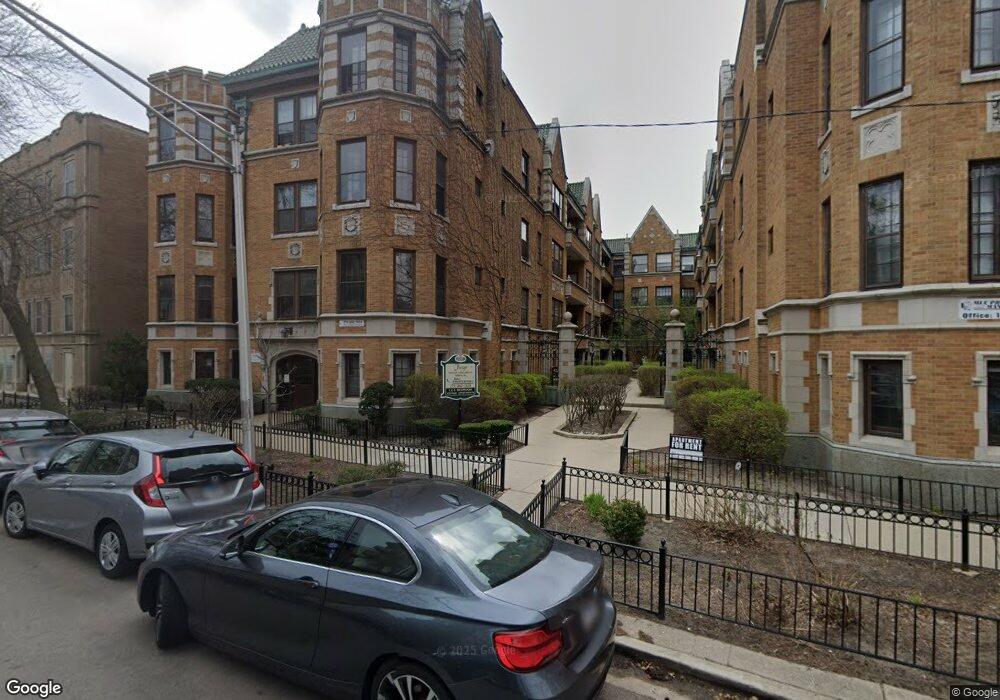
1226 W Jarvis Ave Unit 1226 Chicago, IL 60626
Rogers Park NeighborhoodEstimated Value: $135,000 - $210,000
1
Bed
--
Bath
--
Sq Ft
0.93
Acres
About This Home
This home is located at 1226 W Jarvis Ave Unit 1226, Chicago, IL 60626 and is currently estimated at $171,476. 1226 W Jarvis Ave Unit 1226 is a home located in Cook County with nearby schools including Gale Elementary Community Academy, Sullivan High School, and Chicago Math and Science Academy.
Ownership History
Date
Name
Owned For
Owner Type
Purchase Details
Closed on
Jun 30, 2004
Sold by
Keivit Christopher D
Bought by
Quinlan Elizabeth
Current Estimated Value
Home Financials for this Owner
Home Financials are based on the most recent Mortgage that was taken out on this home.
Original Mortgage
$116,000
Interest Rate
5.5%
Mortgage Type
New Conventional
Purchase Details
Closed on
Aug 17, 1998
Sold by
Lozano Jerry R
Bought by
Keivit Christopher D
Home Financials for this Owner
Home Financials are based on the most recent Mortgage that was taken out on this home.
Original Mortgage
$55,036
Interest Rate
6.68%
Mortgage Type
FHA
Purchase Details
Closed on
Aug 24, 1995
Sold by
Hammond David
Bought by
Lozano Jerry R
Home Financials for this Owner
Home Financials are based on the most recent Mortgage that was taken out on this home.
Original Mortgage
$47,000
Interest Rate
6%
Create a Home Valuation Report for This Property
The Home Valuation Report is an in-depth analysis detailing your home's value as well as a comparison with similar homes in the area
Home Values in the Area
Average Home Value in this Area
Purchase History
| Date | Buyer | Sale Price | Title Company |
|---|---|---|---|
| Quinlan Elizabeth | -- | First American Title Ins Co | |
| Keivit Christopher D | $56,000 | -- | |
| Lozano Jerry R | $49,500 | -- |
Source: Public Records
Mortgage History
| Date | Status | Borrower | Loan Amount |
|---|---|---|---|
| Previous Owner | Quinlan Elizabeth | $116,000 | |
| Previous Owner | Keivit Christopher D | $55,036 | |
| Previous Owner | Lozano Jerry R | $47,000 | |
| Closed | Quinlan Elizabeth | $29,000 |
Source: Public Records
Tax History Compared to Growth
Tax History
| Year | Tax Paid | Tax Assessment Tax Assessment Total Assessment is a certain percentage of the fair market value that is determined by local assessors to be the total taxable value of land and additions on the property. | Land | Improvement |
|---|---|---|---|---|
| 2024 | $2,321 | $14,988 | $1,270 | $13,718 |
| 2023 | $1,559 | $11,000 | $1,016 | $9,984 |
| 2022 | $1,559 | $11,000 | $1,016 | $9,984 |
| 2021 | $1,542 | $10,999 | $1,015 | $9,984 |
| 2020 | $1,028 | $7,717 | $1,015 | $6,702 |
| 2019 | $1,035 | $8,581 | $1,015 | $7,566 |
| 2018 | $1,016 | $8,581 | $1,015 | $7,566 |
| 2017 | $742 | $6,822 | $877 | $5,945 |
| 2016 | $866 | $6,822 | $877 | $5,945 |
| 2015 | $769 | $6,822 | $877 | $5,945 |
| 2014 | $986 | $7,269 | $865 | $6,404 |
| 2013 | $818 | $6,025 | $865 | $5,160 |
Source: Public Records
Map
Nearby Homes
- 1321 W Fargo Ave Unit 2E
- 1206 W Jarvis Ave Unit 1S
- 1205 W Sherwin Ave Unit 412
- 1444 W Fargo Ave Unit 3W
- 7612 N Eastlake Terrace Unit 3N
- 7625 N Eastlake Terrace Unit 104
- 7641 N Eastlake Terrace Unit 1B
- 1340 W Touhy Ave Unit 302
- 1340 W Touhy Ave Unit 106
- 7555 N Rogers Ave
- 7120 N Sheridan Rd Unit 218
- 7120 N Sheridan Rd Unit 211
- 1336 W Estes Ave Unit 1N
- 7639 N Greenview Ave Unit 1E
- 1358 W Estes Ave Unit 1S
- 7311 N Ashland Blvd Unit 1B
- 7311 N Ashland Blvd Unit 2A
- 7637 N Bosworth Ave Unit 2N
- 1545 W Chase Ave Unit 305
- 1354 W Estes Ave Unit 1N
- 1226 W Jarvis Ave Unit 3E
- 1226 W Jarvis Ave Unit 1226
- 1226 W Jarvis Ave Unit 1226
- 1226 W Jarvis Ave Unit 1226
- 1226 W Jarvis Ave Unit 1226
- 1226 W Jarvis Ave Unit 1226
- 1226 W Jarvis Ave Unit 3W
- 1226 W Jarvis Ave Unit 2W
- 1226 W Jarvis Ave Unit 1W
- 1228 W Jarvis Ave Unit 1228
- 1228 W Jarvis Ave Unit 1228
- 1228 W Jarvis Ave Unit 1228
- 1228 W Jarvis Ave Unit 1228
- 1228 W Jarvis Ave Unit 1228
- 1228 W Jarvis Ave Unit 1228
- 1228 W Jarvis Ave Unit 2S
- 1228 W Jarvis Ave Unit 3S
- 1224 W Jarvis Ave Unit 1S
- 1224 W Jarvis Ave Unit 1224
- 1224 W Jarvis Ave Unit 1224