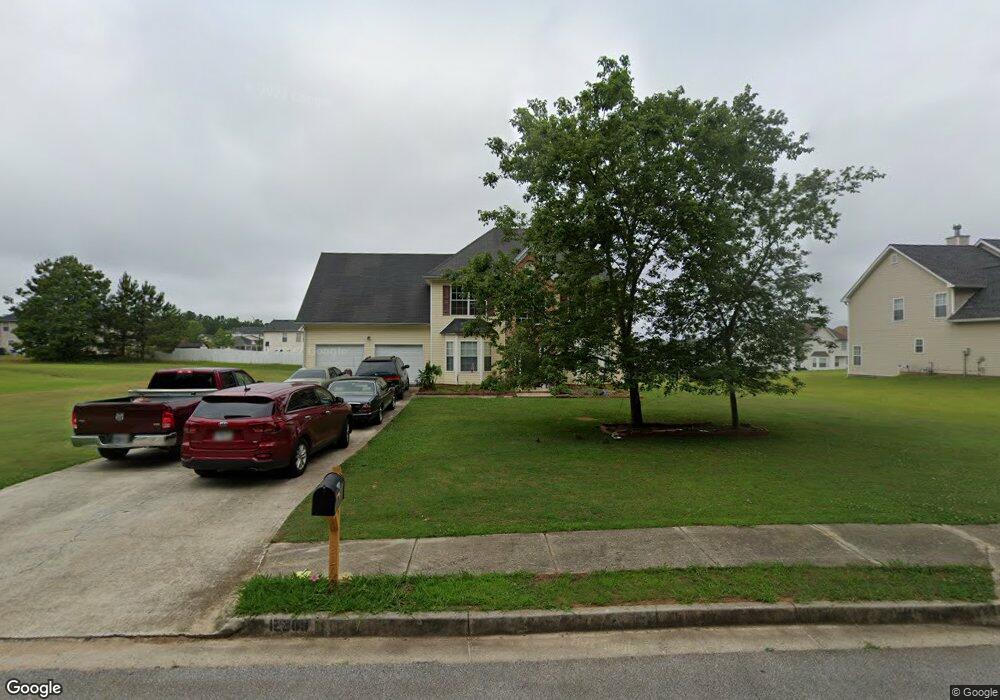
12269 Dickson Rd Hampton, GA 30228
Estimated Value: $294,000 - $312,332
4
Beds
3
Baths
2,690
Sq Ft
$112/Sq Ft
Est. Value
About This Home
This home is located at 12269 Dickson Rd, Hampton, GA 30228 and is currently estimated at $301,833, approximately $112 per square foot. 12269 Dickson Rd is a home located in Clayton County with nearby schools including River's Edge Elementary School, Eddie White Academy, and Lovejoy High School.
Ownership History
Date
Name
Owned For
Owner Type
Purchase Details
Closed on
Nov 15, 2016
Sold by
Hud & Housing Of Urban Dev
Bought by
Hambrick Barney Lee and Hambrick Janet Richardson
Current Estimated Value
Home Financials for this Owner
Home Financials are based on the most recent Mortgage that was taken out on this home.
Original Mortgage
$144,713
Outstanding Balance
$118,768
Interest Rate
4.4%
Mortgage Type
FHA
Estimated Equity
$183,065
Purchase Details
Closed on
Oct 6, 2015
Sold by
Wells Fargo Bank Na
Bought by
Secretary Of Housing And Urban Developme
Purchase Details
Closed on
Jun 5, 2014
Sold by
Ames Broderick Raymond
Bought by
Jenkins Angela
Purchase Details
Closed on
Jul 31, 2003
Sold by
Northbridge Homes Llc
Bought by
Ames Raymond B and Ames Angela
Home Financials for this Owner
Home Financials are based on the most recent Mortgage that was taken out on this home.
Original Mortgage
$161,950
Interest Rate
5.42%
Mortgage Type
FHA
Create a Home Valuation Report for This Property
The Home Valuation Report is an in-depth analysis detailing your home's value as well as a comparison with similar homes in the area
Home Values in the Area
Average Home Value in this Area
Purchase History
| Date | Buyer | Sale Price | Title Company |
|---|---|---|---|
| Hambrick Barney Lee | -- | -- | |
| Hambrick Barney Lee | $138,100 | -- | |
| Secretary Of Housing And Urban Developme | -- | -- | |
| Midfirst Bank | $114,730 | -- | |
| Jenkins Angela | -- | -- | |
| Ames Raymond B | $163,300 | -- |
Source: Public Records
Mortgage History
| Date | Status | Borrower | Loan Amount |
|---|---|---|---|
| Open | Hambrick Barney Lee | $144,713 | |
| Closed | Hambrick Barney Lee | $144,713 | |
| Previous Owner | Ames Raymond B | $161,950 |
Source: Public Records
Map
Nearby Homes
- 12237 Dickson Rd Unit 1
- 526 Canady Ct
- 12283 Coldstream Ct
- 12140 Dominion Dr
- 12275 Styron Dr
- 11961 Markham Way
- 12359 Hillcrest Dr
- 12095 Panhandle Rd
- 12090 Centerra Dr
- 609 Vaughan Dr
- 12328 Edgewater Dr
- 12149 Centerra Dr
- 12155 Centerra Dr
- 0 Panhandle Rd Unit LOT 1 10559919
- 0 Panhandle Rd Unit LOT 4 10559933
- 0 Panhandle Rd Unit LOT 3 10559926
- 570 Oakville Trail
- 11800 Guelph Cir
- 12123 Edgewater Dr
- 609 Caledon Way
- 12257 Dickson Rd Unit 3
- 12281 Dickson Rd Unit 3
- 12224 Dominion Dr
- 12236 Dominion Dr
- 12249 Dickson Rd Unit 3
- 12212 Dominion Dr
- 12248 Dominion Dr Unit 2
- 12200 Dominion Dr Unit 2
- 552 Canady Ct Unit 1
- 192 Kimberwick Dr Unit 1
- 440 N Bridge Rd
- 12188 Dominion Dr Unit 2
- 538 Canady Ct Unit 1
- 12225 Dickson Rd
- 204 Kimberwick Dr
- 0 Panhandle and North Bridge Roads Unit 20004625
- 193 Kimberwick Dr Unit 2
- 537 Canady Ct Unit 1
- 12176 Dominion Dr
- 12295 Coldstream Ct Unit 7
Your Personal Tour Guide
Ask me questions while you tour the home.