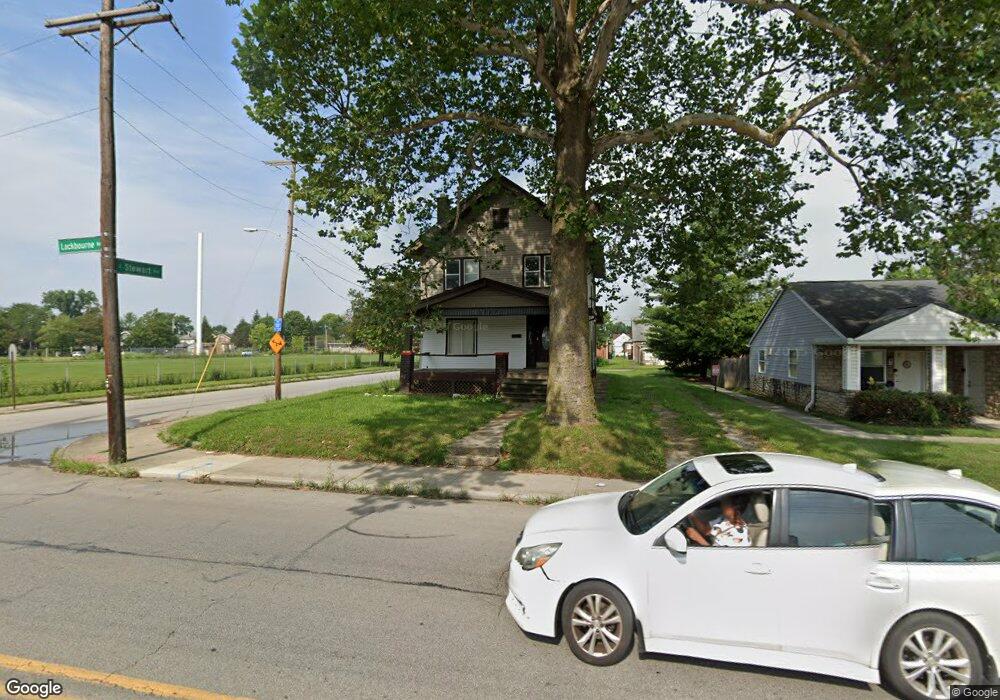
1227 Lockbourne Rd Columbus, OH 43206
Karns Park NeighborhoodEstimated Value: $202,000 - $248,000
3
Beds
1
Bath
1,488
Sq Ft
$155/Sq Ft
Est. Value
About This Home
This home is located at 1227 Lockbourne Rd, Columbus, OH 43206 and is currently estimated at $231,373, approximately $155 per square foot. 1227 Lockbourne Rd is a home located in Franklin County with nearby schools including Moler Elementary School, South High School, and Capital Collegiate Preparatory Academy.
Ownership History
Date
Name
Owned For
Owner Type
Purchase Details
Closed on
Dec 28, 2010
Sold by
Secretary Of Housing & Urban Development
Bought by
Bb & W Investments Ltd
Current Estimated Value
Purchase Details
Closed on
Apr 6, 2010
Sold by
Mccoy Steven D and Case #09Cve 01 821
Bought by
Chase Home Finance Llc
Purchase Details
Closed on
Apr 1, 2010
Sold by
Chase Home Finance Llc
Bought by
Secretary Of Housing & Urban Development
Purchase Details
Closed on
Dec 19, 1995
Sold by
Whiteside Richard E
Bought by
Steven D Mccoy
Home Financials for this Owner
Home Financials are based on the most recent Mortgage that was taken out on this home.
Original Mortgage
$54,422
Interest Rate
7.45%
Mortgage Type
FHA
Purchase Details
Closed on
Jun 5, 1990
Create a Home Valuation Report for This Property
The Home Valuation Report is an in-depth analysis detailing your home's value as well as a comparison with similar homes in the area
Home Values in the Area
Average Home Value in this Area
Purchase History
| Date | Buyer | Sale Price | Title Company |
|---|---|---|---|
| Bb & W Investments Ltd | $10,000 | Lakeside Ti | |
| Chase Home Finance Llc | $50,890 | None Available | |
| Secretary Of Housing & Urban Development | -- | None Available | |
| Steven D Mccoy | $54,000 | -- | |
| -- | -- | -- |
Source: Public Records
Mortgage History
| Date | Status | Borrower | Loan Amount |
|---|---|---|---|
| Previous Owner | Steven D Mccoy | $54,422 |
Source: Public Records
Tax History
| Year | Tax Paid | Tax Assessment Tax Assessment Total Assessment is a certain percentage of the fair market value that is determined by local assessors to be the total taxable value of land and additions on the property. | Land | Improvement |
|---|---|---|---|---|
| 2025 | $8,566 | $84,390 | $28,880 | $55,510 |
| 2024 | $8,566 | $84,390 | $28,880 | $55,510 |
| 2023 | $4,152 | $84,385 | $28,875 | $55,510 |
| 2022 | $2,240 | $32,660 | $7,350 | $25,310 |
| 2021 | $2,197 | $32,660 | $7,350 | $25,310 |
| 2020 | $1,891 | $32,660 | $7,350 | $25,310 |
| 2019 | $1,804 | $25,240 | $5,670 | $19,570 |
| 2018 | $1,344 | $25,240 | $5,670 | $19,570 |
| 2017 | $1,678 | $25,240 | $5,670 | $19,570 |
| 2016 | $1,061 | $14,880 | $4,450 | $10,430 |
| 2015 | $970 | $14,880 | $4,450 | $10,430 |
| 2014 | $923 | $14,880 | $4,450 | $10,430 |
| 2013 | $480 | $15,680 | $4,690 | $10,990 |
Source: Public Records
Map
Nearby Homes
- 960 Studer Ave
- 1282 Lockbourne Rd
- 1318 Lockbourne Rd
- 1338 Lockbourne Rd
- 1329 Studer Ave
- 1212-1218 Wilson Ave
- 1350 Lockbourne Rd
- 1370 Studer Ave
- 1020 E Deshler Ave
- 1398 Lockbourne Rd
- 1120 Oakwood Ave
- 1038 Lockbourne Rd
- 1062 Miller Ave
- 1286-1288 Oakwood Ave Unit 1286
- 1418-1422 Miller Ave
- 1055 Wilson Ave
- 1045 Wilson Ave Unit 47
- 1035 Wilson Ave
- 0 Oakwood Ave
- 1005 Studer Ave
- 1220-1222 Studer Ave
- 1220 Studer Ave Unit 222
- 1216 Studer Ave
- 1210-1212 Studer Ave
- 1210 Studer Ave Unit 212
- 1207 Lockbourne Rd
- 1236 Lockbourne Rd
- 1206 Studer Ave
- 1230 Lockbourne Rd
- 1199 Lockbourne Rd
- 1224 Lockbourne Rd
- 1218 Lockbourne Rd
- 1200 Studer Ave
- 0 Studer Ave Unit 223030968
- 0 Studer Ave Unit 222016097
- 0 Studer Ave
- 1195 Lockbourne Rd
- 1212 Lockbourne Rd
- 859-861 Lockbourne Rd
- 1190 Studer Ave
Your Personal Tour Guide
Ask me questions while you tour the home.