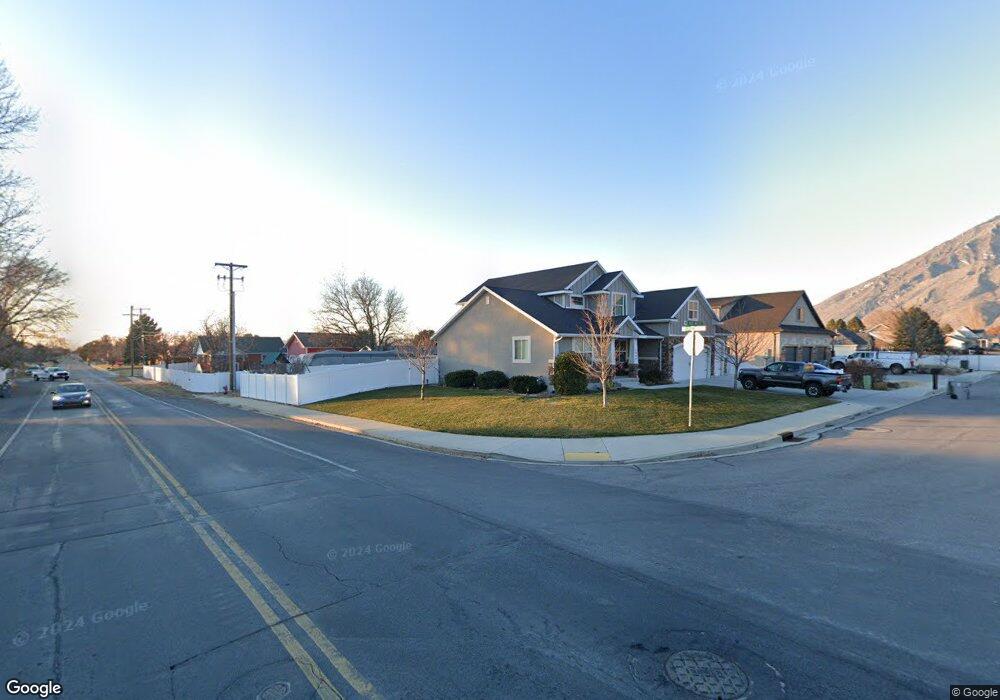
1227 N 200 W Mapleton, UT 84664
Estimated Value: $877,514 - $968,000
6
Beds
4
Baths
4,309
Sq Ft
$216/Sq Ft
Est. Value
About This Home
This home is located at 1227 N 200 W, Mapleton, UT 84664 and is currently estimated at $932,838, approximately $216 per square foot. 1227 N 200 W is a home located in Utah County with nearby schools including Hobble Creek School, Mapleton Junior High School, and Maple Mountain High School.
Ownership History
Date
Name
Owned For
Owner Type
Purchase Details
Closed on
Oct 14, 2014
Sold by
Sierra Homes Construction Inc
Bought by
Peterson Nathan
Current Estimated Value
Home Financials for this Owner
Home Financials are based on the most recent Mortgage that was taken out on this home.
Original Mortgage
$394,000
Outstanding Balance
$301,836
Interest Rate
4.08%
Mortgage Type
New Conventional
Estimated Equity
$631,002
Purchase Details
Closed on
May 8, 2014
Sold by
Eagar Michael and Eagar Keri J
Bought by
Sierra Homes Construction Inc and Sierra Homes Construction South Llc
Home Financials for this Owner
Home Financials are based on the most recent Mortgage that was taken out on this home.
Original Mortgage
$316,360
Interest Rate
4.35%
Mortgage Type
Future Advance Clause Open End Mortgage
Purchase Details
Closed on
Jul 22, 2013
Sold by
Eagar Michael
Bought by
Eagar Michael and Eagar Keri J
Create a Home Valuation Report for This Property
The Home Valuation Report is an in-depth analysis detailing your home's value as well as a comparison with similar homes in the area
Home Values in the Area
Average Home Value in this Area
Purchase History
| Date | Buyer | Sale Price | Title Company |
|---|---|---|---|
| Peterson Nathan | -- | American Secure Title Tremon | |
| Peterson Nathan | -- | American Secure Title Tremon | |
| Sierra Homes Construction Inc | -- | American Secure Title Tremon | |
| Eagar Michael | -- | None Available | |
| Eagar Michael | -- | None Available |
Source: Public Records
Mortgage History
| Date | Status | Borrower | Loan Amount |
|---|---|---|---|
| Open | Peterson Nathan | $394,000 | |
| Previous Owner | Sierra Homes Construction Inc | $316,360 |
Source: Public Records
Tax History
| Year | Tax Paid | Tax Assessment Tax Assessment Total Assessment is a certain percentage of the fair market value that is determined by local assessors to be the total taxable value of land and additions on the property. | Land | Improvement |
|---|---|---|---|---|
| 2025 | $3,837 | $408,045 | -- | -- |
| 2024 | $3,837 | $375,925 | $0 | $0 |
| 2023 | $4,041 | $398,365 | $0 | $0 |
| 2022 | $4,735 | $461,560 | $0 | $0 |
| 2021 | $3,992 | $597,400 | $178,800 | $418,600 |
| 2020 | $3,873 | $560,700 | $158,200 | $402,500 |
| 2019 | $3,451 | $509,900 | $140,200 | $369,700 |
| 2018 | $3,138 | $441,400 | $133,000 | $308,400 |
| 2017 | $2,919 | $217,910 | $0 | $0 |
| 2016 | $2,607 | $193,490 | $0 | $0 |
| 2015 | $2,323 | $171,325 | $0 | $0 |
| 2014 | -- | $86,300 | $0 | $0 |
Source: Public Records
Map
Nearby Homes
- 1350 N Main St
- 897 N Main St
- 145 W Carnesecca Ct
- 667 N 550 W
- 435 E 1000 N
- 405 W 1200 N Unit 4
- 487 W 1200 N Unit 1
- 265 E 600 N
- 84 E 530 N
- 1884 Town And Country Rd
- 1567 N 600 E Unit 26
- 754 W 400 N Unit 29
- 1195 W 1600 N
- 775 N 800 E
- 1121 W 1800 N
- 715 E 1700 N
- 1225 N 1380 W
- 1839 River Bottom Rd
- 1410 W 1200 N
- 1518 E Pheasant Run Dr
Your Personal Tour Guide
Ask me questions while you tour the home.