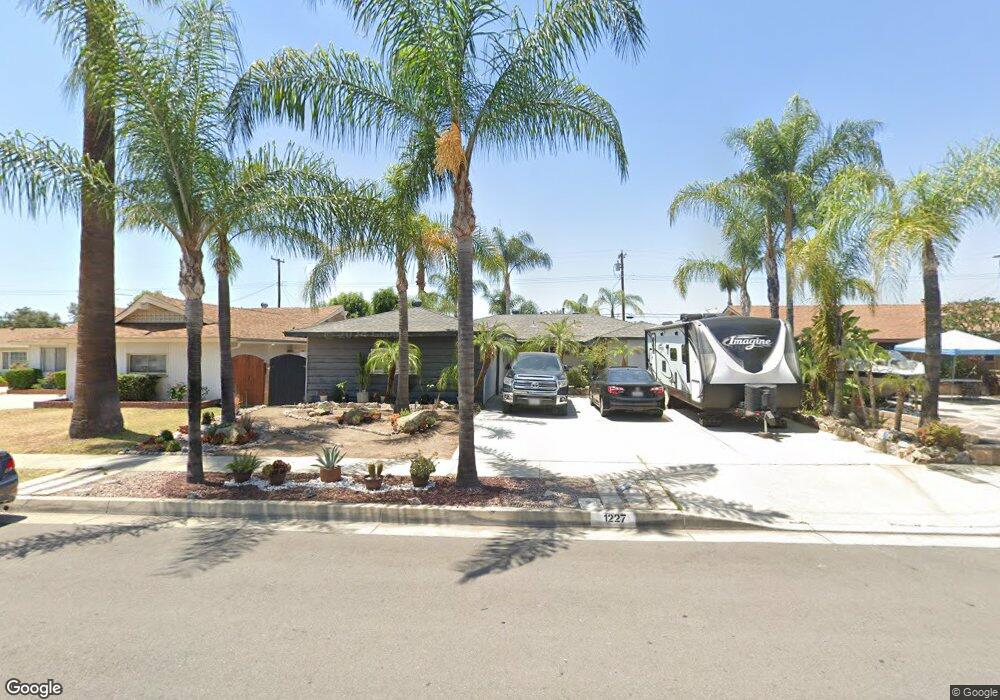
1227 N Stephora Ave Covina, CA 91724
Estimated Value: $821,613 - $908,000
3
Beds
2
Baths
1,645
Sq Ft
$533/Sq Ft
Est. Value
About This Home
This home is located at 1227 N Stephora Ave, Covina, CA 91724 and is currently estimated at $877,153, approximately $533 per square foot. 1227 N Stephora Ave is a home located in Los Angeles County with nearby schools including Cedargrove Elementary School, Royal Oak Middle School, and Charter Oak High School.
Ownership History
Date
Name
Owned For
Owner Type
Purchase Details
Closed on
Jan 29, 2025
Sold by
Ambrose Michael G and Ambrose Cecilia
Bought by
Michael G And Cecilia Ambrose Family Trust and Ambrose
Current Estimated Value
Purchase Details
Closed on
Oct 29, 2001
Sold by
Divine John and Divine Jennifer
Bought by
Ambrose Michael G
Home Financials for this Owner
Home Financials are based on the most recent Mortgage that was taken out on this home.
Original Mortgage
$231,420
Interest Rate
6.84%
Mortgage Type
FHA
Purchase Details
Closed on
Dec 5, 1997
Sold by
Trust Rundall Leola A Tr R R And L A Run
Bought by
Devine John
Home Financials for this Owner
Home Financials are based on the most recent Mortgage that was taken out on this home.
Original Mortgage
$156,810
Interest Rate
7.23%
Mortgage Type
FHA
Create a Home Valuation Report for This Property
The Home Valuation Report is an in-depth analysis detailing your home's value as well as a comparison with similar homes in the area
Home Values in the Area
Average Home Value in this Area
Purchase History
| Date | Buyer | Sale Price | Title Company |
|---|---|---|---|
| Michael G And Cecilia Ambrose Family Trust | -- | None Listed On Document | |
| Ambrose Michael G | $250,000 | First American Title Co | |
| Devine John | $160,000 | Commonwealth Land Title Co |
Source: Public Records
Mortgage History
| Date | Status | Borrower | Loan Amount |
|---|---|---|---|
| Previous Owner | Ambrose Michael G | $231,420 | |
| Previous Owner | Devine John | $156,810 |
Source: Public Records
Tax History Compared to Growth
Tax History
| Year | Tax Paid | Tax Assessment Tax Assessment Total Assessment is a certain percentage of the fair market value that is determined by local assessors to be the total taxable value of land and additions on the property. | Land | Improvement |
|---|---|---|---|---|
| 2025 | $5,197 | $426,897 | $220,844 | $206,053 |
| 2024 | $5,197 | $418,527 | $216,514 | $202,013 |
| 2023 | $5,074 | $410,321 | $212,269 | $198,052 |
| 2022 | $5,011 | $402,276 | $208,107 | $194,169 |
| 2021 | $4,934 | $394,389 | $204,027 | $190,362 |
| 2019 | $4,827 | $382,693 | $197,976 | $184,717 |
| 2018 | $4,594 | $375,191 | $194,095 | $181,096 |
| 2016 | $4,381 | $360,624 | $186,559 | $174,065 |
| 2015 | $4,359 | $355,208 | $183,757 | $171,451 |
| 2014 | $4,349 | $348,251 | $180,158 | $168,093 |
Source: Public Records
Map
Nearby Homes
- 1177 N Reeder Ave
- 5020 N Bonnie Cove Ave
- 1137 N Lyman Ave
- 1954 E Covina Blvd
- 5035 N Greer Ave
- 1912 E Covina Blvd Unit 50
- 2003 E Cienega Ave
- 2028 E Cienega Ave
- 1389 N Sunflower Ave
- 1387 N Sunflower Ave
- 20821 E Calora St Unit E1
- 20805 E Calora St Unit G8
- 20835 E Calora St
- 20963 E Covina Blvd Unit E
- 20232 E Arrow Hwy Unit A
- 1176 N Sunflower Ave
- 1182 N Sunflower Ave
- 2075 E Benwood St
- 1158 N Ivescrest Ave
- 299 E Arrow Hwy Unit 4
- 1235 N Stephora Ave
- 1219 N Stephora Ave
- 1243 N Stephora Ave
- 1211 N Stephora Ave
- 1228 N Reeder Ave
- 1236 N Reeder Ave
- 1220 N Reeder Ave
- 1244 N Reeder Ave
- 1203 N Stephora Ave
- 1251 N Stephora Ave
- 1212 N Reeder Ave
- 1226 N Stephora Ave
- 1234 N Stephora Ave
- 1218 N Stephora Ave
- 1252 N Reeder Ave
- 1210 N Stephora Ave
- 1242 N Stephora Ave
- 1204 N Reeder Ave
- 1181 N Stephora Ave
- 1202 N Stephora Ave