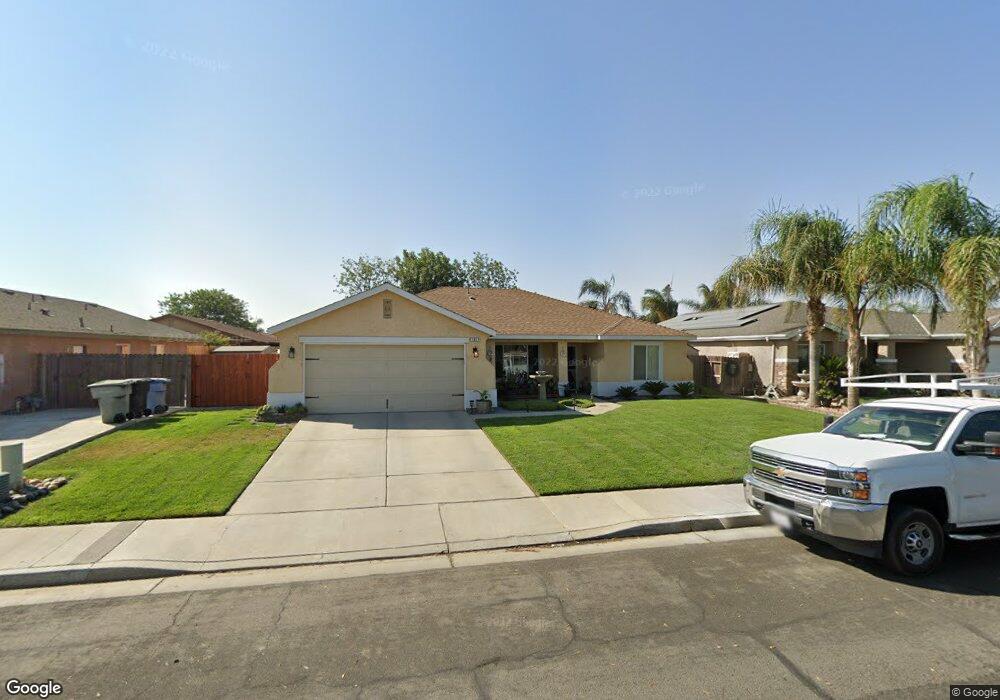
1227 Waterview St Hanford, CA 93230
Estimated Value: $342,000 - $357,000
3
Beds
2
Baths
1,521
Sq Ft
$230/Sq Ft
Est. Value
About This Home
This home is located at 1227 Waterview St, Hanford, CA 93230 and is currently estimated at $349,507, approximately $229 per square foot. 1227 Waterview St is a home located in Kings County with nearby schools including Hamilton Elementary School, John F. Kennedy Junior High School, and Hanford High School.
Ownership History
Date
Name
Owned For
Owner Type
Purchase Details
Closed on
Mar 15, 2011
Sold by
Ekins Matthew E and Ekins Andrea K
Bought by
Nicar Ivan Chester L and Nicar Serena M
Current Estimated Value
Home Financials for this Owner
Home Financials are based on the most recent Mortgage that was taken out on this home.
Original Mortgage
$139,374
Outstanding Balance
$98,902
Interest Rate
5.5%
Mortgage Type
FHA
Estimated Equity
$250,605
Purchase Details
Closed on
May 9, 2005
Sold by
Michaels Jason C
Bought by
Ekins Matthew E and Ekins Andrea K
Home Financials for this Owner
Home Financials are based on the most recent Mortgage that was taken out on this home.
Original Mortgage
$260,482
Interest Rate
5.72%
Mortgage Type
VA
Purchase Details
Closed on
Dec 26, 2003
Sold by
Ennis Homes Inc
Bought by
Michaels Jason C
Home Financials for this Owner
Home Financials are based on the most recent Mortgage that was taken out on this home.
Original Mortgage
$122,382
Interest Rate
5.56%
Mortgage Type
Purchase Money Mortgage
Create a Home Valuation Report for This Property
The Home Valuation Report is an in-depth analysis detailing your home's value as well as a comparison with similar homes in the area
Home Values in the Area
Average Home Value in this Area
Purchase History
| Date | Buyer | Sale Price | Title Company |
|---|---|---|---|
| Nicar Ivan Chester L | $143,000 | Placer Title Company | |
| Ekins Matthew E | $255,000 | Stewart Title Co | |
| Michaels Jason C | $153,000 | First American Title Company |
Source: Public Records
Mortgage History
| Date | Status | Borrower | Loan Amount |
|---|---|---|---|
| Open | Nicar Ivan Chester L | $139,374 | |
| Previous Owner | Ekins Matthew E | $260,482 | |
| Previous Owner | Michaels Jason C | $122,382 | |
| Closed | Michaels Jason C | $22,947 |
Source: Public Records
Tax History Compared to Growth
Tax History
| Year | Tax Paid | Tax Assessment Tax Assessment Total Assessment is a certain percentage of the fair market value that is determined by local assessors to be the total taxable value of land and additions on the property. | Land | Improvement |
|---|---|---|---|---|
| 2025 | $1,906 | $183,205 | $64,058 | $119,147 |
| 2023 | $1,906 | $176,092 | $61,571 | $114,521 |
| 2022 | $1,865 | $172,640 | $60,364 | $112,276 |
| 2021 | $1,824 | $169,256 | $59,181 | $110,075 |
| 2020 | $1,842 | $167,520 | $58,574 | $108,946 |
| 2019 | $1,810 | $164,235 | $57,425 | $106,810 |
| 2018 | $1,758 | $161,015 | $56,299 | $104,716 |
| 2017 | $1,730 | $157,858 | $55,195 | $102,663 |
| 2016 | $1,706 | $154,763 | $54,113 | $100,650 |
| 2015 | $1,695 | $152,438 | $53,300 | $99,138 |
| 2014 | $1,661 | $149,452 | $52,256 | $97,196 |
Source: Public Records
Map
Nearby Homes
- 1249 Levich St
- 98379 9 1 4 Ave
- 956 Clover Ln
- 860 E Grangeville Blvd
- 860 E Grangeville Blvd Unit 98
- 860 E Grangeville Blvd Unit 11
- 860 E Grangeville Blvd Unit 23
- 860 E Grangeville Blvd Unit 117
- 860 E Grangeville Blvd Unit 166
- 920 Moffat Dr
- 852 E Grangeville Blvd Unit 98
- 852 E Grangeville Blvd Unit 6
- 2123 Cottonwood Ct
- 841 Moffat Dr
- 1807 Hardcastle Ave
- 0 E Grangeville Blvd
- 1133 Summer Field Dr
- 2202 Cottonwood Ct
- 1165 Gladys Way
- 1313 N East St
- 1245 Waterview St
- 1213 Waterview St
- 1230 E Donnybrook Place
- 1214 E Donnybrook Place
- 1250 E Donnybrook Place
- 1228 E Waterview St
- 1199 Waterview St
- 1875 Rivermist Ct
- 1228 Waterview St
- 1198 E Donnybrook Place
- 1244 Waterview St
- 1277 Waterview St
- 1185 Waterview St
- 1262 E Waterview St
- 1185 E Waterview St
- 1268 E Donnybrook Place
- 1885 Rivermist Ct
- 1262 Waterview St
- 1176 E Donnybrook Place
- 1297 E Waterview St