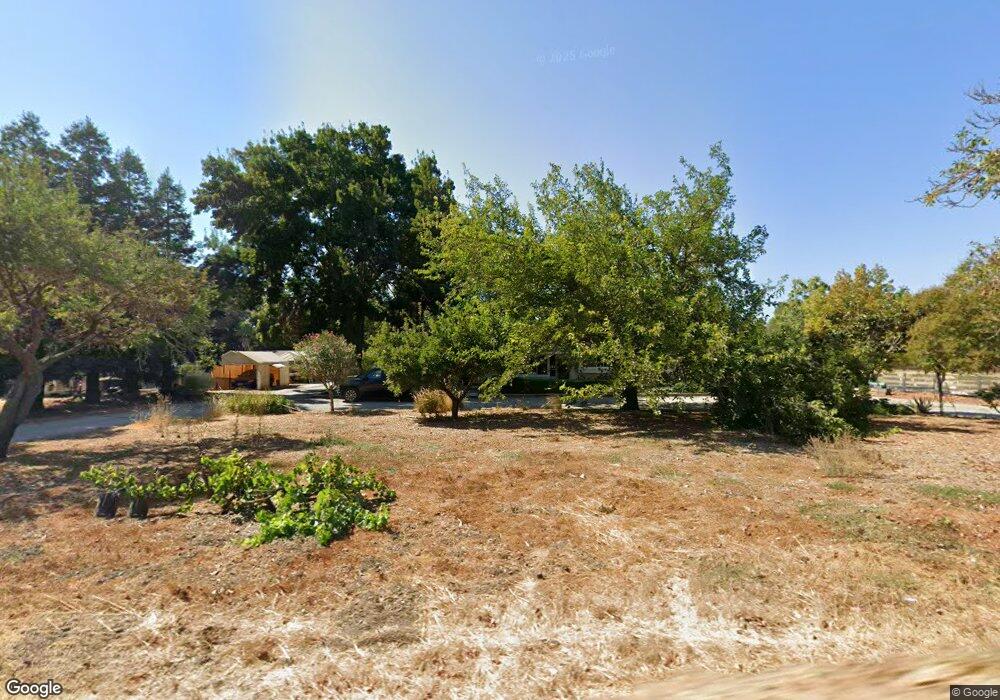
12275 Center Ave San Martin, CA 95046
Estimated Value: $1,591,348 - $1,848,000
4
Beds
3
Baths
2,232
Sq Ft
$758/Sq Ft
Est. Value
About This Home
This home is located at 12275 Center Ave, San Martin, CA 95046 and is currently estimated at $1,691,337, approximately $757 per square foot. 12275 Center Ave is a home located in Santa Clara County with nearby schools including San Martin/Gwinn Environmental Science Academy, Britton Middle School, and Live Oak High School.
Ownership History
Date
Name
Owned For
Owner Type
Purchase Details
Closed on
Aug 10, 2017
Sold by
Graeser Susan Margaret and Graeser Susan
Bought by
Graeser Susan Margaret
Current Estimated Value
Purchase Details
Closed on
Mar 21, 2000
Sold by
Graeser Susan M and Graeser Susan
Bought by
Graeser Susan
Home Financials for this Owner
Home Financials are based on the most recent Mortgage that was taken out on this home.
Original Mortgage
$202,000
Interest Rate
4.95%
Mortgage Type
Purchase Money Mortgage
Purchase Details
Closed on
Jul 22, 1994
Sold by
Graeser Robert C
Bought by
Graeser Susan M and Graeser Susam M
Home Financials for this Owner
Home Financials are based on the most recent Mortgage that was taken out on this home.
Original Mortgage
$90,000
Interest Rate
8.51%
Mortgage Type
Purchase Money Mortgage
Create a Home Valuation Report for This Property
The Home Valuation Report is an in-depth analysis detailing your home's value as well as a comparison with similar homes in the area
Home Values in the Area
Average Home Value in this Area
Purchase History
| Date | Buyer | Sale Price | Title Company |
|---|---|---|---|
| Graeser Susan Margaret | -- | None Available | |
| Graeser Susan | -- | American Title Co | |
| Graeser Susan M | -- | Chicago Title Insurance Co |
Source: Public Records
Mortgage History
| Date | Status | Borrower | Loan Amount |
|---|---|---|---|
| Previous Owner | Graeser Susan | $202,000 | |
| Previous Owner | Graeser Susan M | $90,000 |
Source: Public Records
Tax History Compared to Growth
Tax History
| Year | Tax Paid | Tax Assessment Tax Assessment Total Assessment is a certain percentage of the fair market value that is determined by local assessors to be the total taxable value of land and additions on the property. | Land | Improvement |
|---|---|---|---|---|
| 2025 | $5,097 | $627,400 | $500,000 | $127,400 |
| 2024 | $5,097 | $449,147 | $50,485 | $398,662 |
| 2023 | $5,030 | $440,342 | $49,496 | $390,846 |
| 2022 | $4,947 | $431,709 | $48,526 | $383,183 |
| 2021 | $4,824 | $423,245 | $47,575 | $375,670 |
| 2020 | $4,784 | $418,906 | $47,088 | $371,818 |
| 2019 | $4,915 | $410,693 | $46,165 | $364,528 |
| 2018 | $4,927 | $402,641 | $45,260 | $357,381 |
| 2017 | $4,879 | $394,747 | $44,373 | $350,374 |
| 2016 | $4,567 | $387,007 | $43,503 | $343,504 |
| 2015 | $4,517 | $381,195 | $42,850 | $338,345 |
| 2014 | $4,567 | $373,729 | $42,011 | $331,718 |
Source: Public Records
Map
Nearby Homes
- 12550 Center Ave
- 11840 Foothill Ave
- 1925 Church Ave
- 12467 Creekview Ct
- 13035 Center Ave
- 2115 Gwinn Ave
- 905 E San Martin Ave
- 310 Lena Ave
- 13640 Sycamore Ave
- 145 Masten Ave
- 13705 Sycamore Ave
- 13755 Columbet Ave
- 10980 New Ave
- 12320 Highland Estates Ln
- 2055 Rucker Ave
- 0 W San Martin Ave
- 30 Chester Ave
- 13690 Murphy Ave #E
- 12315 Harding Ave
- 0 Llagas Ave Unit ML82019140
- 12265 Center Ave
- 1394 Maverick Ct
- 12280 Center Ave
- 1505 Chiri Ct
- 1355 Arlia Ct
- 12290 Center Ave
- 1500 Chiri Ct
- 1380 Arlia Ct
- 1300 Maverick Ct
- 1393 Maverick Ct
- 12300 Center Ave
- 1370 Arlia Ct
- 1515 Chiri Ct
- 12240 Center Ave
- 1510 Chiri Ct
- 12235 Center Ave
- 1305 Maverick Ct
- 1360 Arlia Ct
- 1520 Chiri Ct
- 1510 Perino Ln