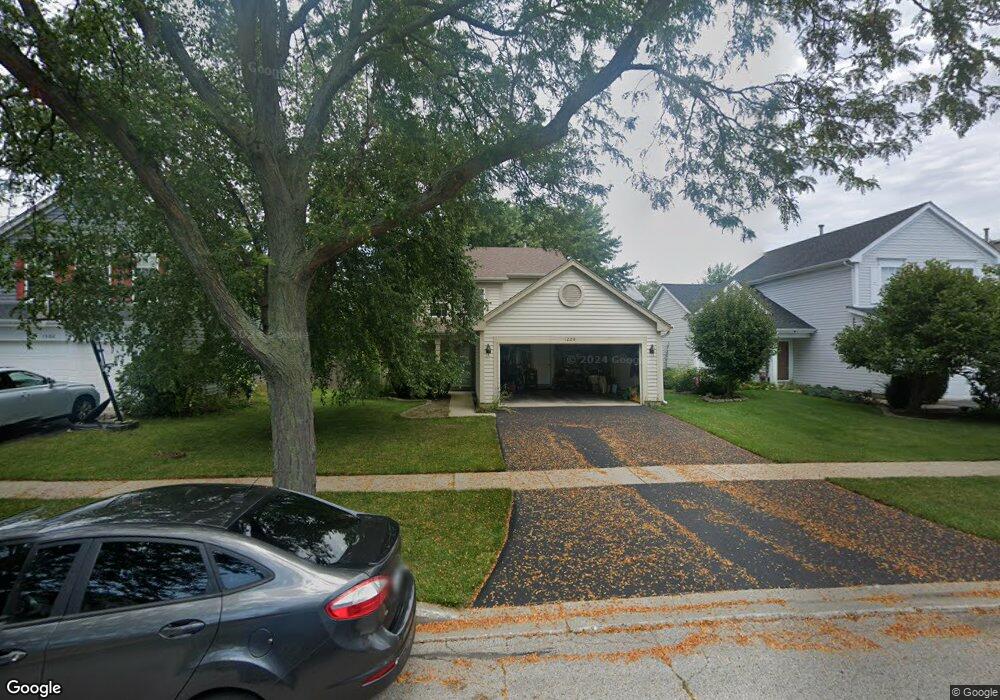
1228 Darnell Dr Mundelein, IL 60060
North Mundelein NeighborhoodEstimated Value: $335,616 - $362,000
3
Beds
2
Baths
1,482
Sq Ft
$234/Sq Ft
Est. Value
About This Home
This home is located at 1228 Darnell Dr, Mundelein, IL 60060 and is currently estimated at $346,654, approximately $233 per square foot. 1228 Darnell Dr is a home located in Lake County with nearby schools including Fremont Elementary School, Fremont Intermediate School, and Fremont Jr High/Middle School.
Ownership History
Date
Name
Owned For
Owner Type
Purchase Details
Closed on
Apr 1, 2017
Sold by
Bahr Dennis
Bought by
Bahr Albert
Current Estimated Value
Purchase Details
Closed on
Apr 21, 2004
Sold by
Day Marlon and Day Lauren
Bought by
Bahr Dennis and Bahr Albert
Home Financials for this Owner
Home Financials are based on the most recent Mortgage that was taken out on this home.
Original Mortgage
$200,000
Interest Rate
5.99%
Mortgage Type
Balloon
Purchase Details
Closed on
Sep 27, 2001
Sold by
Hettinger Thomas E
Bought by
Day Marlon and Day Lauren
Home Financials for this Owner
Home Financials are based on the most recent Mortgage that was taken out on this home.
Original Mortgage
$190,000
Interest Rate
6.8%
Purchase Details
Closed on
Mar 14, 1996
Sold by
Northern Tr Bank Lake Forest Natl Assn
Bought by
Hettinger Thomas E
Home Financials for this Owner
Home Financials are based on the most recent Mortgage that was taken out on this home.
Original Mortgage
$137,200
Interest Rate
7.12%
Create a Home Valuation Report for This Property
The Home Valuation Report is an in-depth analysis detailing your home's value as well as a comparison with similar homes in the area
Home Values in the Area
Average Home Value in this Area
Purchase History
| Date | Buyer | Sale Price | Title Company |
|---|---|---|---|
| Bahr Albert | -- | None Available | |
| Bahr Dennis | $232,000 | Ticor | |
| Day Marlon | $190,000 | Chicago Title Insurance Co | |
| Hettinger Thomas E | $144,500 | Ticor Title Insurance Compan |
Source: Public Records
Mortgage History
| Date | Status | Borrower | Loan Amount |
|---|---|---|---|
| Previous Owner | Bahr Dennis | $200,000 | |
| Previous Owner | Day Marlon | $190,000 | |
| Previous Owner | Hettinger Thomas E | $137,200 |
Source: Public Records
Tax History Compared to Growth
Tax History
| Year | Tax Paid | Tax Assessment Tax Assessment Total Assessment is a certain percentage of the fair market value that is determined by local assessors to be the total taxable value of land and additions on the property. | Land | Improvement |
|---|---|---|---|---|
| 2024 | $6,561 | $87,410 | $17,460 | $69,950 |
| 2023 | $6,016 | $80,090 | $15,998 | $64,092 |
| 2022 | $6,016 | $71,578 | $13,174 | $58,404 |
| 2021 | $5,742 | $69,071 | $12,713 | $56,358 |
| 2020 | $5,751 | $67,170 | $12,363 | $54,807 |
| 2019 | $5,554 | $64,961 | $11,956 | $53,005 |
| 2018 | $5,620 | $66,412 | $11,610 | $54,802 |
| 2017 | $5,557 | $64,322 | $11,245 | $53,077 |
| 2016 | $5,418 | $61,090 | $10,680 | $50,410 |
| 2015 | $5,304 | $57,270 | $10,012 | $47,258 |
| 2014 | $5,234 | $56,761 | $9,924 | $46,837 |
| 2012 | $5,305 | $57,265 | $10,012 | $47,253 |
Source: Public Records
Map
Nearby Homes
- 1216 Kensington Dr
- 620 Salceda Dr
- 360 Ambria Dr
- 531 Salceda Ln
- 1329 Turnberry Ln
- 200 Ambria Dr
- 1300 Kettering Rd
- 1304 Dunleer Dr
- 2330 Somerset Ln
- 1010 Evergreen St Unit 3
- 1152 Aberdeen Ln
- 821 Killarney Pass Cir
- 2607 Martini St
- 2599 Martini St Unit 2599
- 1291 Banbury Rd
- 2732 Fieldcrest Dr
- 973 Highland Rd
- 1021 Wrens Gate
- 3209 Martini St
- 28884 N Il Route 83
- 1300 Darnell Dr
- 1224 Darnell Dr
- 1304 Darnell Dr
- 1220 Darnell Dr
- 1301 Manchester Dr
- 1229 Manchester Dr
- 1305 Manchester Dr
- 1308 Darnell Dr
- 1308 Darnell Dr Unit 1308
- 1309 Manchester Dr
- 1216 Darnell Dr
- 1229 Darnell Dr
- 1221 Manchester Dr
- 1301 Darnell Dr
- 1225 Darnell Dr
- 1313 Manchester Dr
- 1312 Darnell Dr
- 1305 Darnell Dr
- 1221 Darnell Dr