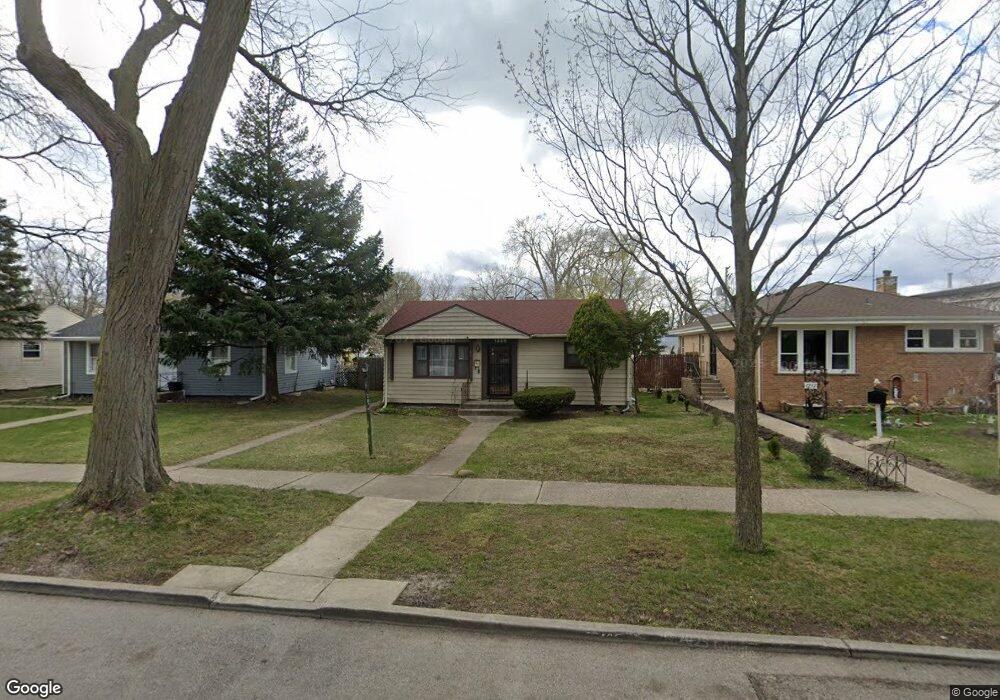
1228 Fowler Ave Evanston, IL 60202
West End NeighborhoodEstimated Value: $283,000 - $541,000
3
Beds
2
Baths
1,244
Sq Ft
$319/Sq Ft
Est. Value
About This Home
This home is located at 1228 Fowler Ave, Evanston, IL 60202 and is currently estimated at $396,222, approximately $318 per square foot. 1228 Fowler Ave is a home located in Cook County with nearby schools including Walker Elementary School, Chute Middle School, and Evanston Township High School.
Ownership History
Date
Name
Owned For
Owner Type
Purchase Details
Closed on
Sep 5, 2007
Sold by
Wells Fargo Bank Na
Bought by
Wellington Michael
Current Estimated Value
Home Financials for this Owner
Home Financials are based on the most recent Mortgage that was taken out on this home.
Original Mortgage
$207,575
Interest Rate
6.33%
Mortgage Type
Unknown
Purchase Details
Closed on
Jul 5, 2007
Sold by
Jones David
Bought by
Wells Fargo Bank Na and Bank Of America Abfc 2005 He2
Purchase Details
Closed on
Apr 26, 2005
Sold by
Jones David
Bought by
Jones David and Jones Stacy
Home Financials for this Owner
Home Financials are based on the most recent Mortgage that was taken out on this home.
Original Mortgage
$227,000
Interest Rate
6.99%
Mortgage Type
New Conventional
Purchase Details
Closed on
Dec 10, 2001
Sold by
Jones Charlene
Bought by
Jones David
Home Financials for this Owner
Home Financials are based on the most recent Mortgage that was taken out on this home.
Original Mortgage
$160,000
Interest Rate
8.95%
Create a Home Valuation Report for This Property
The Home Valuation Report is an in-depth analysis detailing your home's value as well as a comparison with similar homes in the area
Home Values in the Area
Average Home Value in this Area
Purchase History
| Date | Buyer | Sale Price | Title Company |
|---|---|---|---|
| Wellington Michael | $218,500 | Ticor Title | |
| Wells Fargo Bank Na | -- | None Available | |
| Jones David | -- | Citywide Title Corporation | |
| Jones David | -- | -- |
Source: Public Records
Mortgage History
| Date | Status | Borrower | Loan Amount |
|---|---|---|---|
| Previous Owner | Wellington Michael | $207,575 | |
| Previous Owner | Jones David | $227,000 | |
| Previous Owner | Jones David | $160,000 |
Source: Public Records
Tax History
| Year | Tax Paid | Tax Assessment Tax Assessment Total Assessment is a certain percentage of the fair market value that is determined by local assessors to be the total taxable value of land and additions on the property. | Land | Improvement |
|---|---|---|---|---|
| 2025 | $4,765 | $29,000 | $12,325 | $16,675 |
| 2024 | $4,765 | $23,000 | $10,200 | $12,800 |
| 2023 | $4,548 | $23,000 | $10,200 | $12,800 |
| 2022 | $4,548 | $23,000 | $10,200 | $12,800 |
| 2021 | $4,732 | $21,162 | $7,225 | $13,937 |
| 2020 | $4,729 | $21,162 | $7,225 | $13,937 |
| 2019 | $4,724 | $23,592 | $7,225 | $16,367 |
| 2018 | $4,975 | $21,594 | $5,950 | $15,644 |
| 2017 | $4,861 | $21,594 | $5,950 | $15,644 |
| 2016 | $4,833 | $21,594 | $5,950 | $15,644 |
| 2015 | $4,528 | $19,511 | $5,100 | $14,411 |
| 2014 | $4,500 | $19,511 | $5,100 | $14,411 |
| 2013 | $4,380 | $19,511 | $5,100 | $14,411 |
Source: Public Records
Map
Nearby Homes
- 1120 Pitner Ave
- 1321 Pitner Ave Unit A
- 2321 Lee St
- 3334 Wilder St
- 8628 Kimball Ave
- 1133 Dodge Ave
- 8428 Mccormick Blvd
- 1037 Dodge Ave
- 8626 Trumbull Ave
- 1213 Darrow Ave
- 1111 Darrow Ave
- 920 Dodge Ave
- 826 Brown Ave
- 1042 Dewey Ave
- 1710 Lake St
- 8260 N Mccormick Blvd
- 1460 Dewey Ave
- 8953 Central Park Ave
- 8450 Drake Ave
- 8444 Drake Ave
- 1232 Fowler Ave
- 1224 Fowler Ave
- 1220 Fowler Ave
- 2406 Dempster St
- 1216 Fowler Ave
- 2408 Dempster St
- 1229 Mcdaniel Ave
- 1231 Mcdaniel Ave
- 1225 Mcdaniel Ave
- 1212 Fowler Ave
- 1223 Mcdaniel Ave
- 1229 Fowler Ave
- 1225 Fowler Ave
- 2422 Dempster St
- 1233 Fowler Ave
- 1221 Fowler Ave
- 1208 Fowler Ave
- 1237 Fowler Ave
- 1219 Fowler Ave
- 1215 Mcdaniel Ave
Your Personal Tour Guide
Ask me questions while you tour the home.