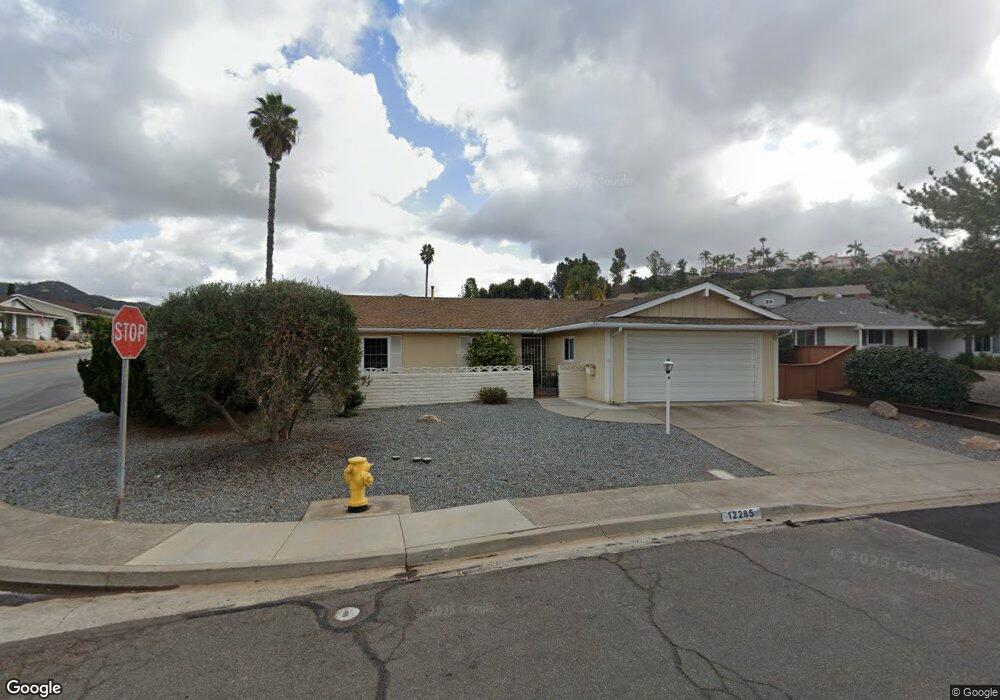
12285 Nivel Ct San Diego, CA 92128
Rancho Bernardo NeighborhoodEstimated Value: $946,231 - $1,002,000
3
Beds
2
Baths
1,521
Sq Ft
$646/Sq Ft
Est. Value
About This Home
This home is located at 12285 Nivel Ct, San Diego, CA 92128 and is currently estimated at $982,308, approximately $645 per square foot. 12285 Nivel Ct is a home located in San Diego County with nearby schools including Highland Ranch Elementary School, Bernardo Heights Middle, and Rancho Bernardo High.
Ownership History
Date
Name
Owned For
Owner Type
Purchase Details
Closed on
Dec 1, 2009
Sold by
Palmer Lynn D and Palmer Joanne
Bought by
Palmer Lynn Dan and Palmer Joanne Lynn
Current Estimated Value
Purchase Details
Closed on
Sep 27, 2000
Sold by
Messinger Robert and Messinger Sandra
Bought by
Palmer Lynn D and Palmer Joanne
Home Financials for this Owner
Home Financials are based on the most recent Mortgage that was taken out on this home.
Original Mortgage
$207,200
Outstanding Balance
$74,645
Interest Rate
7.75%
Estimated Equity
$907,663
Purchase Details
Closed on
Aug 24, 1999
Sold by
Phillips Donald M & Leokadja B Trust
Bought by
Messinger Robert and Messinger Sandra
Purchase Details
Closed on
Feb 3, 1995
Sold by
Phillips Donald M and Phillips Leokadja B
Bought by
Phillips Donald M and Phillips Leokadja B
Create a Home Valuation Report for This Property
The Home Valuation Report is an in-depth analysis detailing your home's value as well as a comparison with similar homes in the area
Home Values in the Area
Average Home Value in this Area
Purchase History
| Date | Buyer | Sale Price | Title Company |
|---|---|---|---|
| Palmer Lynn Dan | -- | None Available | |
| Palmer Lynn D | $259,000 | First American Title | |
| Messinger Robert | $176,500 | First American Title | |
| Phillips Donald M | -- | -- |
Source: Public Records
Mortgage History
| Date | Status | Borrower | Loan Amount |
|---|---|---|---|
| Open | Palmer Lynn D | $207,200 | |
| Closed | Palmer Lynn D | $25,900 |
Source: Public Records
Tax History Compared to Growth
Tax History
| Year | Tax Paid | Tax Assessment Tax Assessment Total Assessment is a certain percentage of the fair market value that is determined by local assessors to be the total taxable value of land and additions on the property. | Land | Improvement |
|---|---|---|---|---|
| 2025 | $4,284 | $390,245 | $218,671 | $171,574 |
| 2024 | $4,284 | $382,594 | $214,384 | $168,210 |
| 2023 | $4,192 | $375,093 | $210,181 | $164,912 |
| 2022 | $4,121 | $367,739 | $206,060 | $161,679 |
| 2021 | $4,066 | $360,529 | $202,020 | $158,509 |
| 2020 | $4,011 | $356,833 | $199,949 | $156,884 |
| 2019 | $3,906 | $349,837 | $196,029 | $153,808 |
| 2018 | $3,795 | $342,979 | $192,186 | $150,793 |
| 2017 | $3,693 | $336,255 | $188,418 | $147,837 |
| 2016 | $3,616 | $329,663 | $184,724 | $144,939 |
| 2015 | $3,561 | $324,712 | $181,950 | $142,762 |
| 2014 | $3,477 | $318,352 | $178,386 | $139,966 |
Source: Public Records
Map
Nearby Homes
- 12249 Horado Rd
- 16421 Ramada Dr
- 12365 Horado Rd
- 16515 Felice Dr
- 12494 Senda Rd
- 12257 Avenida Consentido
- 12195 San Tomas Place
- 16498 Roca Dr
- 12424 Rios Rd
- 16632 Roca Dr Unit 41
- 12486 Lomica Dr
- 16422 Roca Dr
- 16660 Roca Dr
- 16413 Roca Dr
- 16556 Gabarda Rd
- 16182 Selva Dr
- 12093 Callado Rd
- 12047 Avenida Consentido
- 12206 Fairway Pointe Row
- 12085 Calle de Maria
- 12275 Nivel Ct
- 16418 Bernardo Oaks Dr
- 12280 Nivel Ct
- 12265 Nivel Ct
- 16425 Bernardo Oaks Dr Unit 7
- 12276 Horado Rd
- 16435 Bernardo Oaks Dr
- 12296 Horado Rd
- 12286 Horado Rd
- 12266 Horado Rd
- 16415 Bernardo Oaks Dr
- 16445 Bernardo Oaks Dr
- 12260 Nivel Ct
- 12260 Horado Rd
- 12255 Nivel Ct
- 16455 Bernardo Oaks Dr
- 16405 Bernardo Oaks Dr
- 16458 Bernardo Oaks Dr
- 12252 Horado Rd
- 16424 Felice Dr