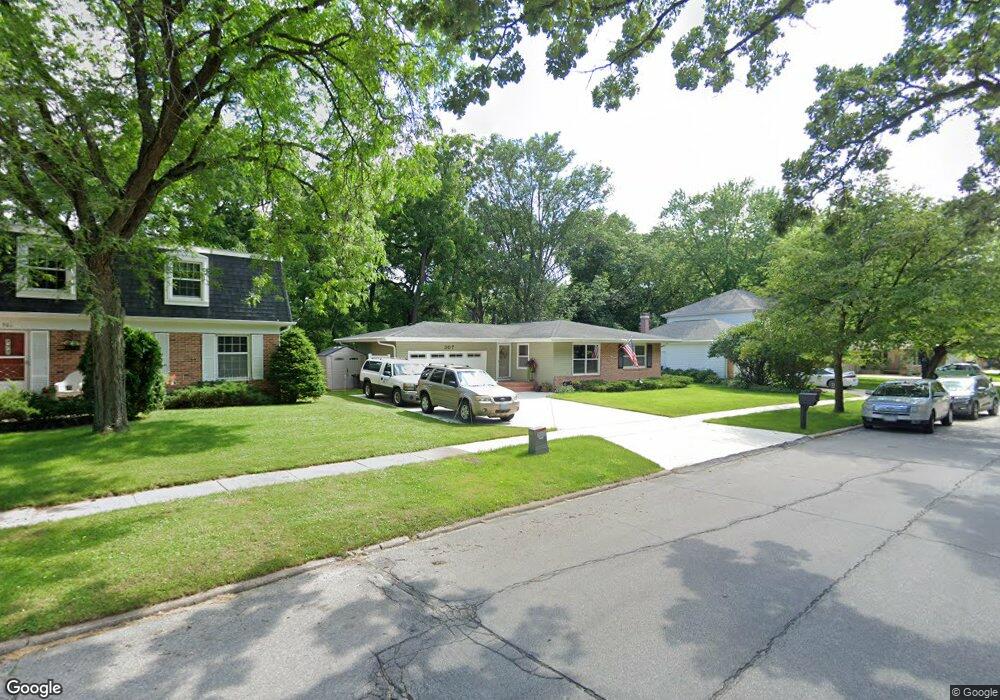
1229 Ahearn Dr NE Unit 1229 Cedar Rapids, IA 52402
Estimated Value: $217,000 - $237,000
2
Beds
2
Baths
1,711
Sq Ft
$133/Sq Ft
Est. Value
About This Home
This home is located at 1229 Ahearn Dr NE Unit 1229, Cedar Rapids, IA 52402 and is currently estimated at $226,975, approximately $132 per square foot. 1229 Ahearn Dr NE Unit 1229 is a home located in Linn County with nearby schools including Westfield Elementary School, Oak Ridge School, and Linn-Mar High School.
Ownership History
Date
Name
Owned For
Owner Type
Purchase Details
Closed on
Dec 16, 2013
Sold by
Shanklin William D and Shanklin Susan A
Bought by
Foote Bok Ja
Current Estimated Value
Purchase Details
Closed on
Oct 4, 2012
Sold by
Shanklin William D
Bought by
Shanklin William D and Shanklin Susan A
Purchase Details
Closed on
Jul 13, 2006
Sold by
Kraft Kathy B
Bought by
Shanklin William D
Home Financials for this Owner
Home Financials are based on the most recent Mortgage that was taken out on this home.
Original Mortgage
$109,600
Interest Rate
6.72%
Mortgage Type
Purchase Money Mortgage
Purchase Details
Closed on
Dec 6, 2001
Sold by
Daley Jeffrey M and Daley Kathy A
Bought by
Kraft Kathy B
Home Financials for this Owner
Home Financials are based on the most recent Mortgage that was taken out on this home.
Original Mortgage
$104,000
Interest Rate
6.6%
Create a Home Valuation Report for This Property
The Home Valuation Report is an in-depth analysis detailing your home's value as well as a comparison with similar homes in the area
Home Values in the Area
Average Home Value in this Area
Purchase History
| Date | Buyer | Sale Price | Title Company |
|---|---|---|---|
| Foote Bok Ja | $135,000 | None Available | |
| Shanklin William D | -- | None Available | |
| Shanklin William D | $136,500 | None Available | |
| Kraft Kathy B | $129,500 | -- |
Source: Public Records
Mortgage History
| Date | Status | Borrower | Loan Amount |
|---|---|---|---|
| Previous Owner | Shanklin William D | $109,600 | |
| Previous Owner | Kraft Kathy B | $104,000 |
Source: Public Records
Tax History Compared to Growth
Tax History
| Year | Tax Paid | Tax Assessment Tax Assessment Total Assessment is a certain percentage of the fair market value that is determined by local assessors to be the total taxable value of land and additions on the property. | Land | Improvement |
|---|---|---|---|---|
| 2025 | $3,528 | $208,800 | $31,500 | $177,300 |
| 2024 | $3,744 | $206,200 | $28,000 | $178,200 |
| 2023 | $3,744 | $206,200 | $28,000 | $178,200 |
| 2022 | $3,328 | $176,100 | $28,000 | $148,100 |
| 2021 | $3,628 | $162,700 | $24,500 | $138,200 |
| 2020 | $3,628 | $166,400 | $22,000 | $144,400 |
| 2019 | $2,890 | $136,200 | $22,000 | $114,200 |
| 2018 | $2,806 | $136,200 | $22,000 | $114,200 |
| 2017 | $2,920 | $139,200 | $13,500 | $125,700 |
| 2016 | $2,877 | $131,900 | $13,500 | $118,400 |
| 2015 | $2,957 | $135,342 | $13,500 | $121,842 |
| 2014 | $2,762 | $135,342 | $13,500 | $121,842 |
| 2013 | $2,738 | $135,342 | $13,500 | $121,842 |
Source: Public Records
Map
Nearby Homes
- 6410 Creekside Dr NE
- 6430 Creekside Dr NE Unit 4
- 6715 Creekside Dr NE Unit 2
- 0 Council St NE
- 1407 Tower Ln NE Unit 1407
- 1472 Tower Ln NE Unit 5
- 1450 Tower Ln NE
- 6807 Kingswood Ln NE
- 327 Meadows Field Dr NE
- 1008 Doubletree Ct NE Unit 1008
- 1215 Prairieview Dr NE
- 1226 Prairieview Dr NE
- 6965 Doubletree Rd NE Unit 6965
- 7128 Summerland Ridge Rd NE
- 6701 Stonybrook Ln NE
- 733 Broderick Dr NE Unit B
- 1241 74th St NE Unit 1241
- 6040 Purple Dr NE
- 1055 74th St NE Unit 1055
- 935 74th St NE Unit 1
- 1225 Ahearn Dr NE Unit 1225
- 1233 Ahearn Dr NE
- 1221 Ahearn Dr NE Unit 1221
- 1221 A'Hearn Dr NE
- 1225 A'Hearn Dr NE Unit 1225
- 1305 Ahearn Dr NE Unit 1305
- 1215 Ahearn Dr NE Unit 1215
- 1309 Ahearn Dr NE
- 1211 Ahearn Dr NE Unit 1211
- 1313 Ahearn Dr NE Unit 1313
- 1313 A'Hearn Dr NE
- 1235 Crossings Ct NE
- 1207 Ahearn Dr NE Unit 1207
- 1223 Crossings Ct NE
- 1317 Ahearn Dr NE Unit 1317
- 1227 Crossings Ct NE
- 1203 Ahearn Dr NE
- 1317 A'Hearn Dr NE
- 1217 Crossings Ct NE
- 1231 Crossings Ct NE