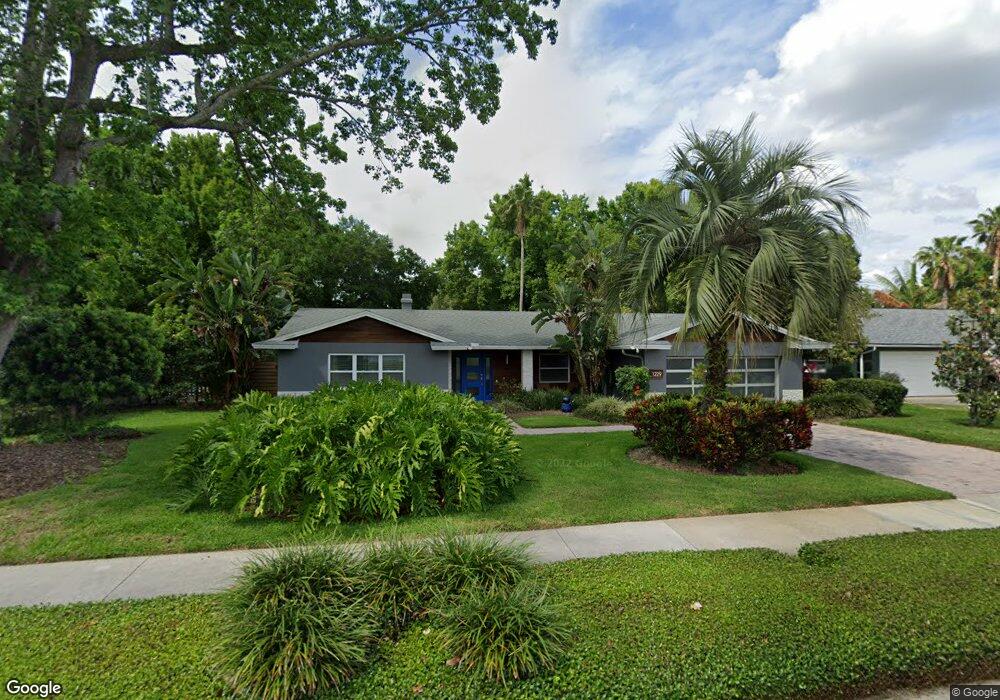
1229 Appleton Ave Orlando, FL 32806
Southern Oaks NeighborhoodEstimated Value: $607,000 - $770,000
4
Beds
2
Baths
2,318
Sq Ft
$284/Sq Ft
Est. Value
About This Home
This home is located at 1229 Appleton Ave, Orlando, FL 32806 and is currently estimated at $658,285, approximately $283 per square foot. 1229 Appleton Ave is a home located in Orange County with nearby schools including Pershing Elementary School, Boone High School, and Cornerstone Charter Academy High School.
Ownership History
Date
Name
Owned For
Owner Type
Purchase Details
Closed on
Jun 23, 2016
Sold by
Ross Randolph Scott and Ross Mary S W
Bought by
Ortiz Vincent A
Current Estimated Value
Home Financials for this Owner
Home Financials are based on the most recent Mortgage that was taken out on this home.
Original Mortgage
$403,987
Outstanding Balance
$321,529
Interest Rate
3.57%
Mortgage Type
New Conventional
Estimated Equity
$336,756
Purchase Details
Closed on
Feb 16, 2012
Sold by
Ross R Scott and Ross Mary S
Bought by
Ross Randolph Scott and Ross Mary S W
Purchase Details
Closed on
May 11, 2011
Sold by
Ross R Scott and Ross Mary S
Bought by
Ross Randolph Scott and Ross Mary S W
Purchase Details
Closed on
Oct 29, 2010
Sold by
Offner Colleen S
Bought by
Ross R Scott and Ross Mary S
Home Financials for this Owner
Home Financials are based on the most recent Mortgage that was taken out on this home.
Original Mortgage
$292,800
Interest Rate
4.33%
Mortgage Type
New Conventional
Create a Home Valuation Report for This Property
The Home Valuation Report is an in-depth analysis detailing your home's value as well as a comparison with similar homes in the area
Home Values in the Area
Average Home Value in this Area
Purchase History
| Date | Buyer | Sale Price | Title Company |
|---|---|---|---|
| Ortiz Vincent A | $425,300 | North American Title Company | |
| Ross Randolph Scott | -- | Attorney | |
| Ross Randolph Scott | -- | Attorney | |
| Ross R Scott | $366,000 | Attorney |
Source: Public Records
Mortgage History
| Date | Status | Borrower | Loan Amount |
|---|---|---|---|
| Open | Ortiz Vincent A | $403,987 | |
| Previous Owner | Ross R Scott | $292,800 |
Source: Public Records
Tax History
| Year | Tax Paid | Tax Assessment Tax Assessment Total Assessment is a certain percentage of the fair market value that is determined by local assessors to be the total taxable value of land and additions on the property. | Land | Improvement |
|---|---|---|---|---|
| 2025 | $6,393 | $392,078 | -- | -- |
| 2024 | $5,888 | $381,028 | -- | -- |
| 2023 | $5,888 | $359,505 | $0 | $0 |
| 2022 | $5,718 | $349,034 | $0 | $0 |
| 2021 | $5,626 | $338,868 | $0 | $0 |
| 2020 | $5,356 | $334,189 | $0 | $0 |
| 2019 | $5,447 | $322,800 | $100,000 | $222,800 |
| 2018 | $6,194 | $358,923 | $0 | $0 |
| 2017 | $6,115 | $351,541 | $80,000 | $271,541 |
| 2016 | $4,209 | $248,158 | $70,000 | $178,158 |
| 2015 | $4,561 | $261,112 | $70,000 | $191,112 |
| 2014 | $5,030 | $287,056 | $70,000 | $217,056 |
Source: Public Records
Map
Nearby Homes
- 1053 Sweetbriar Rd
- 1617 Campbell Ave
- 4615 S Ferncreek Ave
- 3857 Martin St
- 1619 Montcalm St
- 4512 Crichton Ln
- 1905 Pershing Ave
- 924 Wald Rd
- 726 Albertson Place
- 3246 Inverness Ct
- 1903 Simonton Ave
- 1892 White Ave
- 1914 Geigel Ave
- 3606 S Forest St
- 4836 Big Oaks Ln
- 1920 Baxter Ave
- 3010 Carmia Dr
- 3226 S Osceola Ave
- 3058 Brandywine Dr
- 3052 Saratoga Dr
- 1301 Appleton Ave
- 1215 Appleton Ave
- 1313 Appleton Ave
- 1207 Appleton Ave
- 1238 Appleton Ave
- 1222 Appleton Ave
- 1342 Campbell St
- 1306 Appleton Ave
- 1210 Campbell St
- 1214 Appleton Ave
- 1364 Campbell St
- 1327 Appleton Ave
- 1206 Campbell St
- 1314 Appleton Ave
- 1200 Appleton Ave
- 1219 Overlake Ave
- 1305 Overlake Ave
- 1386 Campbell St
- 1143 Appleton Ave
- 1335 Appleton Ave
Your Personal Tour Guide
Ask me questions while you tour the home.