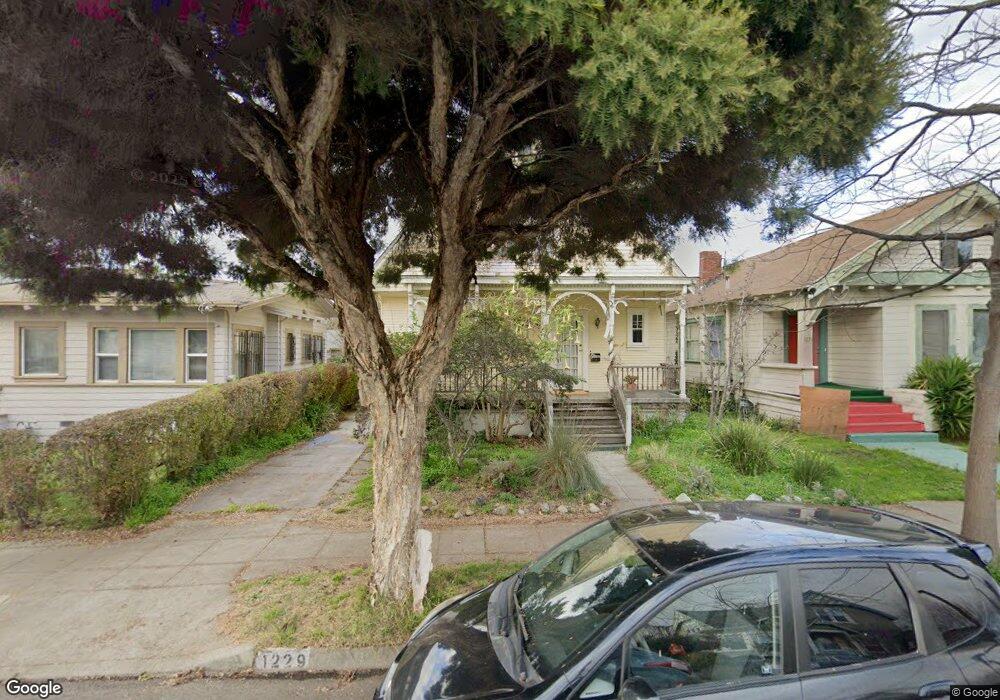
1229 Carrison St Berkeley, CA 94702
West Berkeley NeighborhoodEstimated Value: $1,088,000 - $1,722,000
3
Beds
1
Bath
1,687
Sq Ft
$804/Sq Ft
Est. Value
About This Home
This home is located at 1229 Carrison St, Berkeley, CA 94702 and is currently estimated at $1,356,853, approximately $804 per square foot. 1229 Carrison St is a home located in Alameda County with nearby schools including Malcolm X Elementary School, Oxford Elementary School, and Washington Elementary School.
Ownership History
Date
Name
Owned For
Owner Type
Purchase Details
Closed on
Jun 1, 2020
Sold by
Murch Donald W and Hake Sarah C
Bought by
Murch Donald W and Hake Sarah C
Current Estimated Value
Purchase Details
Closed on
May 16, 2003
Sold by
Wooton Paul A and Wooton Daniela E
Bought by
Murch Donald W and Hake Sarah C
Purchase Details
Closed on
Apr 12, 1995
Sold by
Hewitt George M and Nelson Carrie
Bought by
Wooton Paul A and Wooton Daniela E
Home Financials for this Owner
Home Financials are based on the most recent Mortgage that was taken out on this home.
Original Mortgage
$90,000
Interest Rate
8.6%
Create a Home Valuation Report for This Property
The Home Valuation Report is an in-depth analysis detailing your home's value as well as a comparison with similar homes in the area
Home Values in the Area
Average Home Value in this Area
Purchase History
| Date | Buyer | Sale Price | Title Company |
|---|---|---|---|
| Murch Donald W | -- | None Available | |
| Murch Donald W | $437,000 | Old Republic Title Company | |
| Wooton Paul A | $90,000 | Placer Title Company |
Source: Public Records
Mortgage History
| Date | Status | Borrower | Loan Amount |
|---|---|---|---|
| Previous Owner | Wooton Paul A | $90,000 |
Source: Public Records
Tax History
| Year | Tax Paid | Tax Assessment Tax Assessment Total Assessment is a certain percentage of the fair market value that is determined by local assessors to be the total taxable value of land and additions on the property. | Land | Improvement |
|---|---|---|---|---|
| 2025 | $10,196 | $625,863 | $189,859 | $443,004 |
| 2024 | $10,196 | $613,456 | $186,137 | $434,319 |
| 2023 | $9,978 | $608,294 | $182,488 | $425,806 |
| 2022 | $9,785 | $589,368 | $178,910 | $417,458 |
| 2021 | $9,797 | $577,678 | $175,403 | $409,275 |
| 2020 | $9,242 | $578,687 | $173,606 | $405,081 |
| 2019 | $8,845 | $567,343 | $170,203 | $397,140 |
| 2018 | $8,688 | $556,221 | $166,866 | $389,355 |
| 2017 | $8,372 | $545,318 | $163,595 | $381,723 |
| 2016 | $8,079 | $534,630 | $160,389 | $374,241 |
| 2015 | $7,968 | $526,601 | $157,980 | $368,621 |
| 2014 | $7,903 | $516,288 | $154,886 | $361,402 |
Source: Public Records
Map
Nearby Homes
- 1237 Ashby Ave
- 3032 Mabel St
- 1080 67th St
- 1314 Ashby Ave
- 6628 Helen Ct
- 6500 San Pablo Ave
- 6501 San Pablo Ave Unit 410
- 6465 San Pablo Ave Unit 203
- 2751 Wallace St
- 2747 San Pablo Ave Unit 507
- 1126 Ocean Ave
- 1034 Grayson St
- 1164 Ocean Ave
- 1200 65th St Unit 224
- 1010 Grayson St
- 1507 Prince St
- 3101 Sacramento St
- 1156 64th St
- 1161 64th St
- 811 Folger Ave
- 1231 Carrison St
- 1225 Carrison St
- 1233 Carrison St
- 1221 Carrison St
- 1234 Ashby Ave
- 1219 Carrison St
- 1237 Carrison St
- 1239 Carrison St
- 1215 Carrison St
- 1236 Ashby Ave
- 1241 Carrison St
- 1206 Carrison St
- 1216 Carrison St
- 1238 Ashby Ave
- 1212 Carrison St
- 1214 Ashby Ave Unit E
- 1214 Ashby Ave Unit C
- 1214 Ashby Ave Unit D
- 1214 Ashby Ave Unit B
- 1214 Ashby Ave Unit A
Your Personal Tour Guide
Ask me questions while you tour the home.