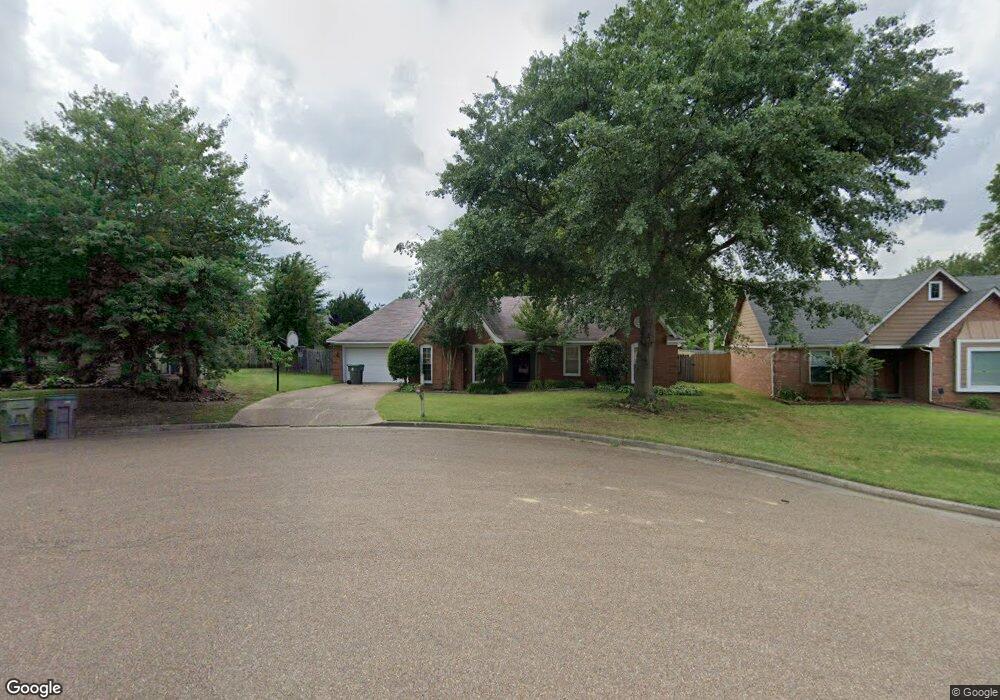
1229 Creeks Edge Cove Cordova, TN 38016
Cordova NeighborhoodEstimated Value: $241,000 - $253,870
3
Beds
2
Baths
1,677
Sq Ft
$148/Sq Ft
Est. Value
About This Home
This home is located at 1229 Creeks Edge Cove, Cordova, TN 38016 and is currently estimated at $247,468, approximately $147 per square foot. 1229 Creeks Edge Cove is a home located in Shelby County with nearby schools including Riverwood Elementary School, Cordova Middle School, and Cordova High School.
Ownership History
Date
Name
Owned For
Owner Type
Purchase Details
Closed on
Mar 31, 2008
Sold by
Prudential Relocation Inc
Bought by
Munday Earl W
Current Estimated Value
Home Financials for this Owner
Home Financials are based on the most recent Mortgage that was taken out on this home.
Original Mortgage
$103,500
Interest Rate
6.49%
Mortgage Type
Purchase Money Mortgage
Purchase Details
Closed on
Mar 25, 2008
Sold by
Thompson Pamela J and Thompson Russell John Tarcisius
Bought by
Prudential Relocation Inc
Home Financials for this Owner
Home Financials are based on the most recent Mortgage that was taken out on this home.
Original Mortgage
$103,500
Interest Rate
6.49%
Mortgage Type
Purchase Money Mortgage
Purchase Details
Closed on
Jun 29, 2001
Sold by
Stallings Michael Dewayne and Stallings Amber Camille
Bought by
Thompson Pamela J
Home Financials for this Owner
Home Financials are based on the most recent Mortgage that was taken out on this home.
Original Mortgage
$109,000
Interest Rate
7.17%
Create a Home Valuation Report for This Property
The Home Valuation Report is an in-depth analysis detailing your home's value as well as a comparison with similar homes in the area
Home Values in the Area
Average Home Value in this Area
Purchase History
| Date | Buyer | Sale Price | Title Company |
|---|---|---|---|
| Munday Earl W | $115,000 | None Available | |
| Prudential Relocation Inc | $125,000 | Edco Title & Closing Service | |
| Thompson Pamela J | $144,000 | Realty Title & Escrow Co |
Source: Public Records
Mortgage History
| Date | Status | Borrower | Loan Amount |
|---|---|---|---|
| Previous Owner | Munday Earl W | $103,500 | |
| Previous Owner | Thompson Pamela J | $109,000 |
Source: Public Records
Tax History Compared to Growth
Tax History
| Year | Tax Paid | Tax Assessment Tax Assessment Total Assessment is a certain percentage of the fair market value that is determined by local assessors to be the total taxable value of land and additions on the property. | Land | Improvement |
|---|---|---|---|---|
| 2025 | $1,392 | $61,325 | $12,700 | $48,625 |
| 2024 | $1,392 | $41,050 | $7,375 | $33,675 |
| 2023 | $2,501 | $41,050 | $7,375 | $33,675 |
| 2022 | $2,501 | $41,050 | $7,375 | $33,675 |
| 2021 | $2,530 | $41,050 | $7,375 | $33,675 |
| 2020 | $2,199 | $30,350 | $7,375 | $22,975 |
| 2019 | $2,199 | $30,350 | $7,375 | $22,975 |
| 2018 | $2,199 | $30,350 | $7,375 | $22,975 |
| 2017 | $1,247 | $30,350 | $7,375 | $22,975 |
| 2016 | $1,208 | $27,650 | $0 | $0 |
| 2014 | $1,208 | $27,650 | $0 | $0 |
Source: Public Records
Map
Nearby Homes
- 1235 Creeks Edge Cove
- 8271 Shallow Rock Cove
- 1235 Dexter Ln
- 7999 Club Center Dr
- 8130 Shallow Glen Trail
- 8277 Glen Rock Cove
- 8495 Farley Ave
- 2288 Germantown Dr
- 970 Cully Rd
- 984 Nesting Wood Cir E
- 7952 Meadow Trail Dr
- 8545 Woodland Rose Cir S
- 8544 Woodland Rose Cir S
- 8349 Honey Dew Cove
- 8453 Thor Rd
- 1595 Beaver Trail Ln
- 1206 Chapel Park Blvd
- 901 Timber Grove Dr
- 7893 Bentwood Cir
- 7875 Brady Creek Cove
- 1221 Creeks Edge Cove
- 1234 Sandy Stone Ln
- 1226 Sandy Stone Ln
- 1240 Sandy Stone Ln
- 1241 Creeks Edge Cove
- 1222 Sandy Stone Ln
- 1220 Creeks Edge Cove
- 8214 Hampton Wood Cove
- 1230 Creeks Edge Cove
- 1226 Creeks Edge Cove
- 1248 Sandy Stone Ln
- 1212 Sandy Stone Ln
- 1238 Creeks Edge Cove
- 1249 Creeks Edge Cove
- 8220 Hampton Wood Cove
- 8210 Hampton Wood Cove
- 1246 Creeks Edge Cove
- 1235 Sandy Stone Ln
- 1227 Sandy Stone Ln
- 1206 Sandy Stone Ln