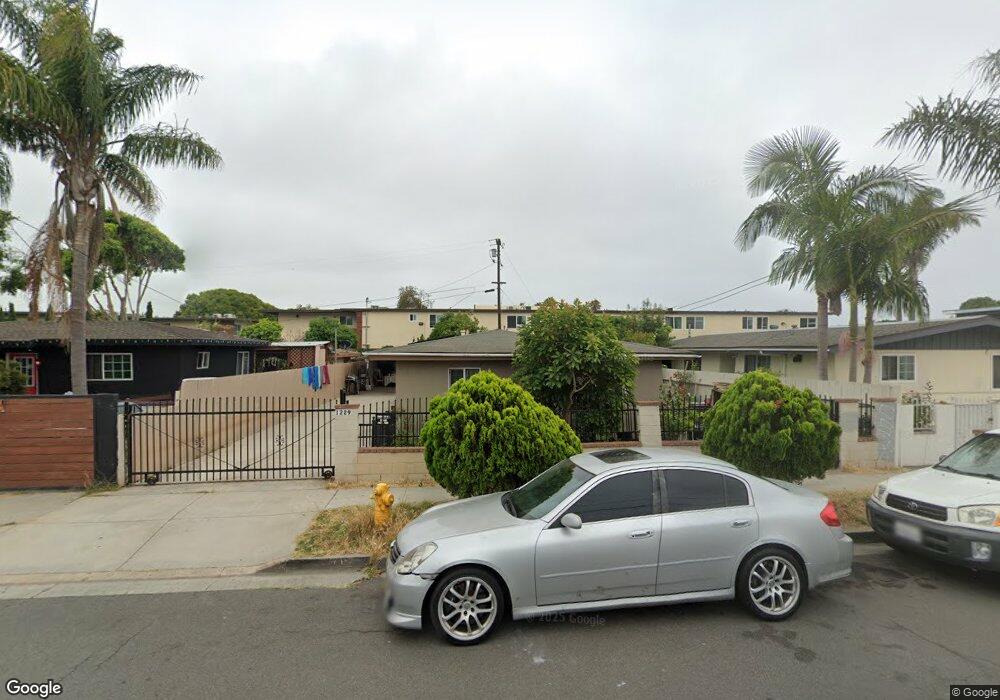
1229 Division St Oceanside, CA 92054
Downtown Oceanside NeighborhoodEstimated Value: $638,000 - $965,000
3
Beds
2
Baths
1,011
Sq Ft
$841/Sq Ft
Est. Value
About This Home
This home is located at 1229 Division St, Oceanside, CA 92054 and is currently estimated at $849,887, approximately $840 per square foot. 1229 Division St is a home located in San Diego County with nearby schools including South Oceanside Elementary School, Lincoln Middle School, and Oceanside High School.
Ownership History
Date
Name
Owned For
Owner Type
Purchase Details
Closed on
Aug 14, 1998
Sold by
Hector Ahumada
Bought by
Ahumada Epigmenio and Ahumada Beatriz
Current Estimated Value
Purchase Details
Closed on
May 2, 1995
Sold by
Canchola Robert M and Canchola Gail M
Bought by
Ahumada Epigmenio and Ahumada Beatriz
Home Financials for this Owner
Home Financials are based on the most recent Mortgage that was taken out on this home.
Original Mortgage
$70,183
Interest Rate
8.51%
Mortgage Type
FHA
Create a Home Valuation Report for This Property
The Home Valuation Report is an in-depth analysis detailing your home's value as well as a comparison with similar homes in the area
Home Values in the Area
Average Home Value in this Area
Purchase History
| Date | Buyer | Sale Price | Title Company |
|---|---|---|---|
| Ahumada Epigmenio | -- | -- | |
| Ahumada Epigmenio | $70,000 | Stewart Title Company |
Source: Public Records
Mortgage History
| Date | Status | Borrower | Loan Amount |
|---|---|---|---|
| Closed | Ahumada Epigmenio | $70,183 |
Source: Public Records
Tax History
| Year | Tax Paid | Tax Assessment Tax Assessment Total Assessment is a certain percentage of the fair market value that is determined by local assessors to be the total taxable value of land and additions on the property. | Land | Improvement |
|---|---|---|---|---|
| 2025 | $1,238 | $115,405 | $50,292 | $65,113 |
| 2024 | $1,238 | $113,143 | $49,306 | $63,837 |
| 2023 | $1,198 | $110,926 | $48,340 | $62,586 |
| 2022 | $1,179 | $108,752 | $47,393 | $61,359 |
| 2021 | $1,182 | $106,620 | $46,464 | $60,156 |
| 2020 | $1,146 | $105,528 | $45,988 | $59,540 |
| 2019 | $1,112 | $103,460 | $45,087 | $58,373 |
| 2018 | $1,099 | $101,432 | $44,203 | $57,229 |
| 2017 | $70 | $99,444 | $43,337 | $56,107 |
| 2016 | $1,040 | $97,495 | $42,488 | $55,007 |
| 2015 | $1,010 | $96,031 | $41,850 | $54,181 |
| 2014 | $972 | $94,151 | $41,031 | $53,120 |
Source: Public Records
Map
Nearby Homes
- 1223 Division St
- 301 S Horne St
- 520 Grant St
- 324 S Nevada St
- 509 Rockledge St
- 1635 E Minnesota Ave Unit 1,3
- 911 Minnesota Ave
- 1330 Bush St
- 525 S Freeman St
- 421 N Weitzel St
- 503 505 N Nevada St
- 114 S Tremont St
- 909 Leonard Ave
- 1786 Jasmine Way
- 509 N Horne St
- 1120 Sea Glass Way
- 1121 Makena Way
- 465 S Cleveland St Unit 103
- 515 N Nevada St
- 522 S Cleveland St Unit 7
- 1231 Division St
- 1227 Division St
- 1221 Division St
- 1239 Division St
- 1224 Division St
- 1243 Division St
- 1219 Division St
- 415 Grant St
- 1228 Division St
- 1230 Division St
- 409 Grant St
- 1215 Division St
- 1249 Division St Unit A
- 1249 Division St
- 1214 Division St Unit 20
- 1232 Division St
- 1213 Division St
- 339 Grant St
- 339 Grant St
- 1234 Division St
Your Personal Tour Guide
Ask me questions while you tour the home.