1229 Formby Ct Unit MB Myrtle Beach, SC 29588
Burgess NeighborhoodEstimated Value: $295,000 - $306,000
2
Beds
2
Baths
1,645
Sq Ft
$182/Sq Ft
Est. Value
About This Home
This home is located at 1229 Formby Ct Unit MB, Myrtle Beach, SC 29588 and is currently estimated at $299,628, approximately $182 per square foot. 1229 Formby Ct Unit MB is a home located in Horry County with nearby schools including St. James Elementary School, St. James Middle School, and St. James Intermediate.
Ownership History
Date
Name
Owned For
Owner Type
Purchase Details
Closed on
Nov 9, 2020
Sold by
Sirignano Andrew M
Bought by
Prince Brittany Susan and Prince Mark Neal
Current Estimated Value
Home Financials for this Owner
Home Financials are based on the most recent Mortgage that was taken out on this home.
Original Mortgage
$201,400
Outstanding Balance
$178,183
Interest Rate
2.8%
Mortgage Type
New Conventional
Estimated Equity
$121,445
Purchase Details
Closed on
Nov 9, 2005
Sold by
Sirignano Andrew M
Bought by
Sirignano Andrew M and 1229 Formby Court Realty Trust
Purchase Details
Closed on
Oct 1, 2002
Sold by
Santarella Robin M and Santarella Robin M
Bought by
Sirignano Andrew M
Home Financials for this Owner
Home Financials are based on the most recent Mortgage that was taken out on this home.
Original Mortgage
$8,000
Interest Rate
6.18%
Mortgage Type
Stand Alone Second
Purchase Details
Closed on
Oct 21, 1999
Sold by
Santarella Gary J
Bought by
Santarella Robin M
Create a Home Valuation Report for This Property
The Home Valuation Report is an in-depth analysis detailing your home's value as well as a comparison with similar homes in the area
Home Values in the Area
Average Home Value in this Area
Purchase History
| Date | Buyer | Sale Price | Title Company |
|---|---|---|---|
| Prince Brittany Susan | $212,000 | -- | |
| Sirignano Andrew M | -- | -- | |
| Sirignano Andrew M | $110,000 | -- | |
| Santarella Robin M | $10,000 | -- |
Source: Public Records
Mortgage History
| Date | Status | Borrower | Loan Amount |
|---|---|---|---|
| Open | Prince Brittany Susan | $201,400 | |
| Previous Owner | Sirignano Andrew M | $8,000 | |
| Previous Owner | Sirignano Andrew M | $88,000 |
Source: Public Records
Tax History Compared to Growth
Tax History
| Year | Tax Paid | Tax Assessment Tax Assessment Total Assessment is a certain percentage of the fair market value that is determined by local assessors to be the total taxable value of land and additions on the property. | Land | Improvement |
|---|---|---|---|---|
| 2024 | $978 | $11,433 | $3,228 | $8,205 |
| 2023 | $978 | $8,411 | $1,223 | $7,188 |
| 2021 | $885 | $8,411 | $1,223 | $7,188 |
| 2020 | $557 | $8,831 | $1,835 | $6,996 |
| 2019 | $557 | $8,831 | $1,835 | $6,996 |
| 2018 | $521 | $7,981 | $1,453 | $6,528 |
| 2017 | $506 | $7,981 | $1,453 | $6,528 |
| 2016 | -- | $7,981 | $1,453 | $6,528 |
| 2015 | $1,727 | $7,981 | $1,453 | $6,528 |
| 2014 | $1,669 | $7,981 | $1,453 | $6,528 |
Source: Public Records
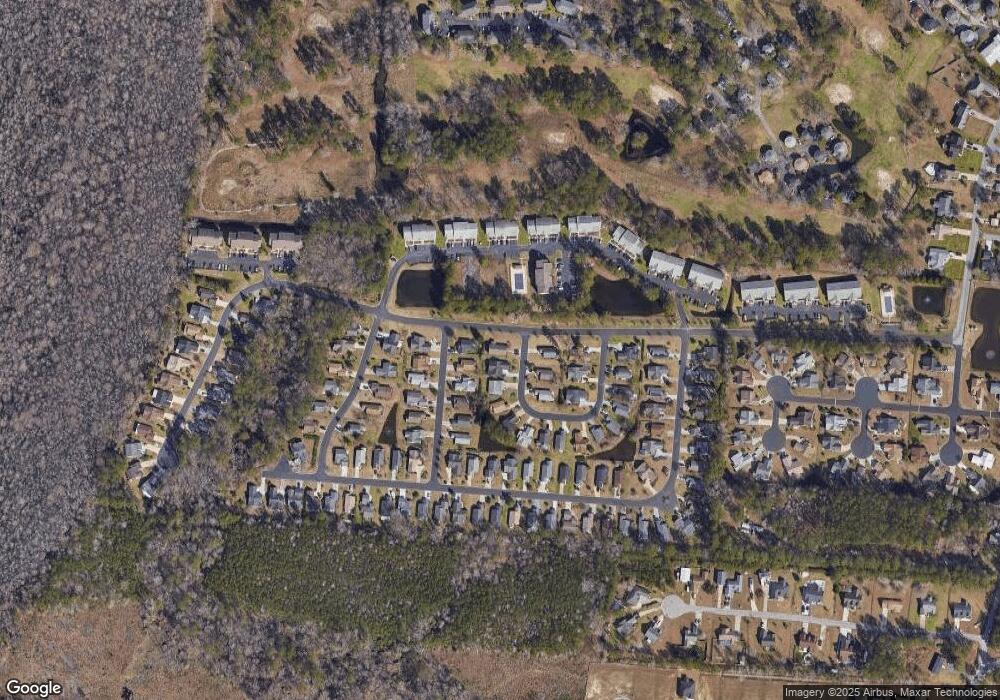
Map
Nearby Homes
- 1230 White Tree Ln Unit F
- 1240 White Tree Ln Unit G
- 1440 Blue Tree Ct
- 1503 Saint George Ln
- 1450 Blue Tree Ct Unit I
- 1460 Blue Tree Ct Unit E
- 863 Tall Oaks Ct Unit B-63
- 752 Tall Oaks Ct
- 1514 Saint George Ln
- 1516 Saint George Ln
- 622 Tall Oaks Ln
- 742 Tall Oaks Ct
- 740 Tall Oaks Ct
- 444 Freewoods Park Ct
- 925 Fairwood Lakes Ln Unit 25-J
- 923 Fairwood Lakes Ln Unit 23-C
- 922 Fairwood Lakes Ln Unit 22-D
- 102 Saint Andrews Ln
- 512 Tree Top Ln
- 512 Tree Top Ln Unit up/down
- 1229 Formby Ct
- 1227 Formby Ct
- 1301 Walton Heath Dr
- TBD Saint George Ln Unit WHITE TREE LANE
- TBD Saint George Ln
- 1303 Walton Heath Dr
- 1225 Formby Ct
- 1305 Walton Heath Dr
- 1228 Saint George Ln
- 1223 Formby Ct
- 1218 Formby Ct
- 1307 Walton Heath Dr
- 1221 Formby Ct
- 1200 Formby Ct
- 1300 Walton Heath Dr
- 1309 Walton Heath Dr
- 1302 Walton Heath Dr
- 1202 Formby Ct
- 1230 White Tree Ln Unit A
- 1230 White Tree Ln