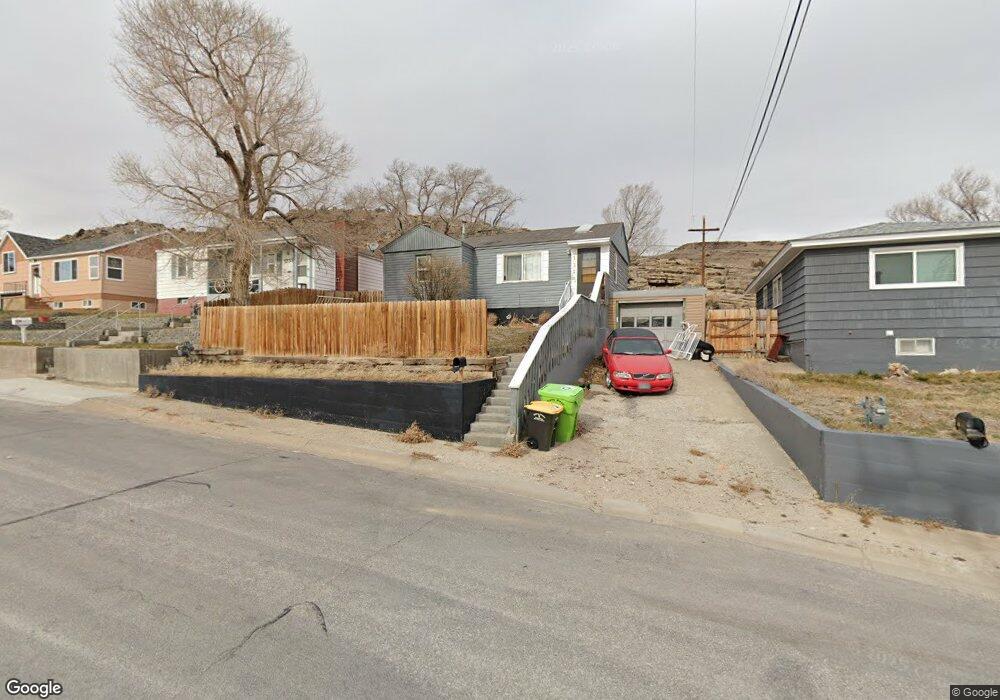
1229 High St Rawlins, WY 82301
Estimated Value: $131,592 - $191,000
--
Bed
--
Bath
712
Sq Ft
$220/Sq Ft
Est. Value
About This Home
This home is located at 1229 High St, Rawlins, WY 82301 and is currently estimated at $156,398, approximately $219 per square foot. 1229 High St is a home with nearby schools including Rawlins Elementary School, Rawlins Middle School, and Rawlins High School.
Ownership History
Date
Name
Owned For
Owner Type
Purchase Details
Closed on
Sep 19, 2012
Sold by
Secretary Of Housing & Urban Development
Bought by
Mcmacken William P and Mack Concepts
Current Estimated Value
Purchase Details
Closed on
Jun 14, 2012
Sold by
Nicholson Dillon M and Mortgage Electronic Registrati
Bought by
The Secretary Of Housing & Urban Develop
Purchase Details
Closed on
Aug 24, 2010
Sold by
Nicholson Dillon M
Bought by
Bac Home Loans Servicing Lp
Purchase Details
Closed on
Feb 16, 2005
Sold by
Bargsten Travis D and Bargsten Sarah M
Bought by
Nicholson Dillon M
Home Financials for this Owner
Home Financials are based on the most recent Mortgage that was taken out on this home.
Original Mortgage
$66,800
Interest Rate
7.59%
Mortgage Type
Adjustable Rate Mortgage/ARM
Create a Home Valuation Report for This Property
The Home Valuation Report is an in-depth analysis detailing your home's value as well as a comparison with similar homes in the area
Home Values in the Area
Average Home Value in this Area
Purchase History
| Date | Buyer | Sale Price | Title Company |
|---|---|---|---|
| Mcmacken William P | -- | None Available | |
| The Secretary Of Housing & Urban Develop | $107,066 | None Available | |
| Bac Home Loans Servicing Lp | -- | None Available | |
| Nicholson Dillon M | -- | None Available |
Source: Public Records
Mortgage History
| Date | Status | Borrower | Loan Amount |
|---|---|---|---|
| Previous Owner | Nicholson Dillon M | $66,800 |
Source: Public Records
Tax History Compared to Growth
Tax History
| Year | Tax Paid | Tax Assessment Tax Assessment Total Assessment is a certain percentage of the fair market value that is determined by local assessors to be the total taxable value of land and additions on the property. | Land | Improvement |
|---|---|---|---|---|
| 2025 | $883 | $9,018 | $2,160 | $6,858 |
| 2024 | $883 | $12,231 | $2,880 | $9,351 |
| 2023 | $903 | $12,504 | $2,618 | $9,886 |
| 2022 | $810 | $11,065 | $2,618 | $8,447 |
| 2021 | $810 | $9,988 | $1,649 | $8,339 |
| 2020 | $718 | $19,852 | $3,298 | $16,554 |
| 2019 | $678 | $9,435 | $1,649 | $7,786 |
| 2018 | $705 | $9,644 | $1,649 | $7,995 |
| 2017 | $693 | $9,528 | $1,649 | $7,879 |
| 2016 | $684 | $9,406 | $1,649 | $7,757 |
| 2015 | -- | $9,167 | $1,649 | $7,518 |
| 2014 | -- | $8,301 | $1,649 | $6,652 |
Source: Public Records
Map
Nearby Homes
- 1233 High St
- 1225 High St
- 1228 High St
- 1210 Mountain View Blvd Unit Veterans
- 1210 Mountain View Blvd
- 1241 High St
- 1216 Mountain View Blvd
- 1236 High St
- 1166 Mountain View Blvd
- 1220 Mountain View Blvd
- 1305 High St
- 1156 Mountain View Blvd
- 1211 High St
- 1211 High St Unit Mountain View
- 1310 Mountain View Blvd
- 1150 Mountain View Blvd
- 1309 High St
- 1146 Mountain View Blvd
- 1212 Veterans Ave
- 1126 12th St