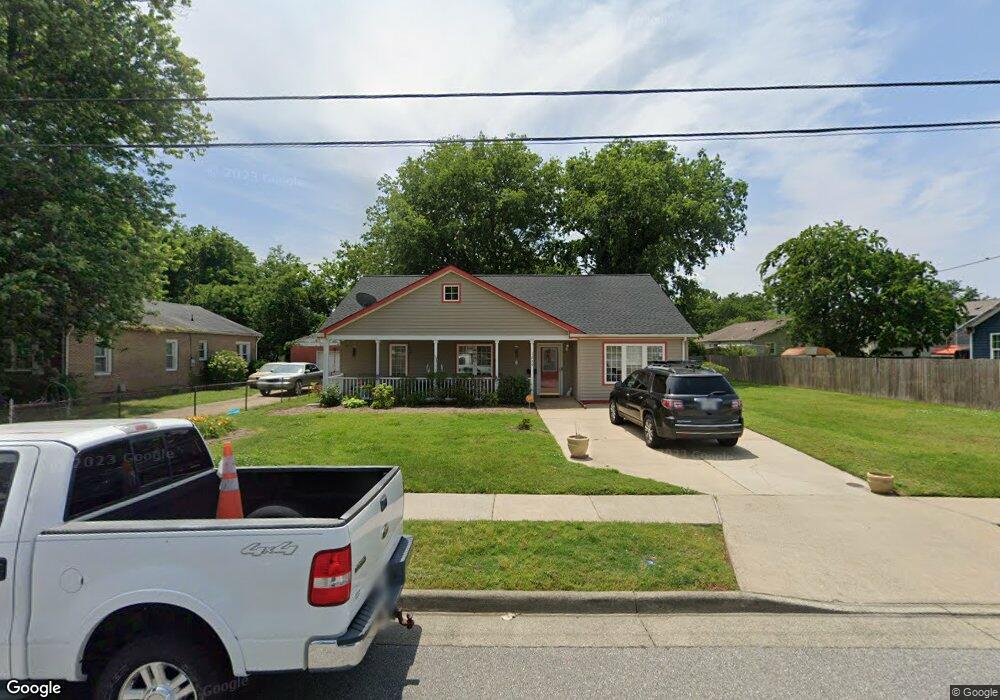
1229 Quash St Hampton, VA 23669
Old North Hampton NeighborhoodEstimated Value: $257,000 - $302,483
3
Beds
2
Baths
1,647
Sq Ft
$174/Sq Ft
Est. Value
About This Home
This home is located at 1229 Quash St, Hampton, VA 23669 and is currently estimated at $287,121, approximately $174 per square foot. 1229 Quash St is a home located in Hampton City with nearby schools including Mary S. Peake Elementary School, C. Alton Lindsay Middle School, and Kecoughtan High School.
Ownership History
Date
Name
Owned For
Owner Type
Purchase Details
Closed on
Jun 9, 2022
Sold by
Lucas Lenton R
Bought by
Lucas Lenton R
Current Estimated Value
Purchase Details
Closed on
Mar 28, 2022
Sold by
Lucas Lenton R
Bought by
Lucas Lenton R and Lucas Olivia Mason
Home Financials for this Owner
Home Financials are based on the most recent Mortgage that was taken out on this home.
Original Mortgage
$199,800
Interest Rate
3.92%
Mortgage Type
VA
Purchase Details
Closed on
Jul 31, 2006
Sold by
Hampton Redev & Hsng Auth
Bought by
Lucas Lenton R
Home Financials for this Owner
Home Financials are based on the most recent Mortgage that was taken out on this home.
Original Mortgage
$173,565
Interest Rate
6.7%
Mortgage Type
FHA
Create a Home Valuation Report for This Property
The Home Valuation Report is an in-depth analysis detailing your home's value as well as a comparison with similar homes in the area
Home Values in the Area
Average Home Value in this Area
Purchase History
| Date | Buyer | Sale Price | Title Company |
|---|---|---|---|
| Lucas Lenton R | -- | New Title Company Name | |
| Lucas Lenton R | -- | Alpha Title | |
| Lucas Lenton R | $178,000 | -- |
Source: Public Records
Mortgage History
| Date | Status | Borrower | Loan Amount |
|---|---|---|---|
| Previous Owner | Lucas Lenton R | $199,800 | |
| Previous Owner | Lucas Lenton R | $173,565 |
Source: Public Records
Tax History
| Year | Tax Paid | Tax Assessment Tax Assessment Total Assessment is a certain percentage of the fair market value that is determined by local assessors to be the total taxable value of land and additions on the property. | Land | Improvement |
|---|---|---|---|---|
| 2025 | $148 | $300,900 | $41,500 | $259,400 |
| 2024 | $3,104 | $269,900 | $37,400 | $232,500 |
| 2023 | $142 | $242,800 | $37,400 | $205,400 |
| 2022 | $2,742 | $232,400 | $37,400 | $195,000 |
| 2021 | $1,223 | $186,700 | $24,900 | $161,800 |
| 2020 | $2,190 | $176,600 | $24,900 | $151,700 |
| 2019 | $2,140 | $172,600 | $24,900 | $147,700 |
| 2018 | $2,124 | $165,200 | $24,900 | $140,300 |
| 2017 | $2,142 | $0 | $0 | $0 |
| 2016 | $2,106 | $162,300 | $0 | $0 |
| 2015 | $2,106 | $0 | $0 | $0 |
| 2014 | $2,503 | $158,400 | $24,900 | $133,500 |
Source: Public Records
Map
Nearby Homes
- 1307 West Ave
- 1209 Parkside Ave
- 712 Langley Ave
- 1127 Rowe St
- 718 Langley Ave
- 323 Bassette St
- 915 Langley Ave
- 925 Quash St
- 994 N King St
- 845 N King St
- 710 N Back River Rd
- 741 N Back River Rd Unit B
- 741 N Back River Rd Unit A
- 28 N Gawain Way
- 36 S Gawain Way
- 8 N Gawain Way
- 33 Clayton Dr
- 22 Lucas Dr
- 382 Union St
- 201 Courtney Dr
Your Personal Tour Guide
Ask me questions while you tour the home.