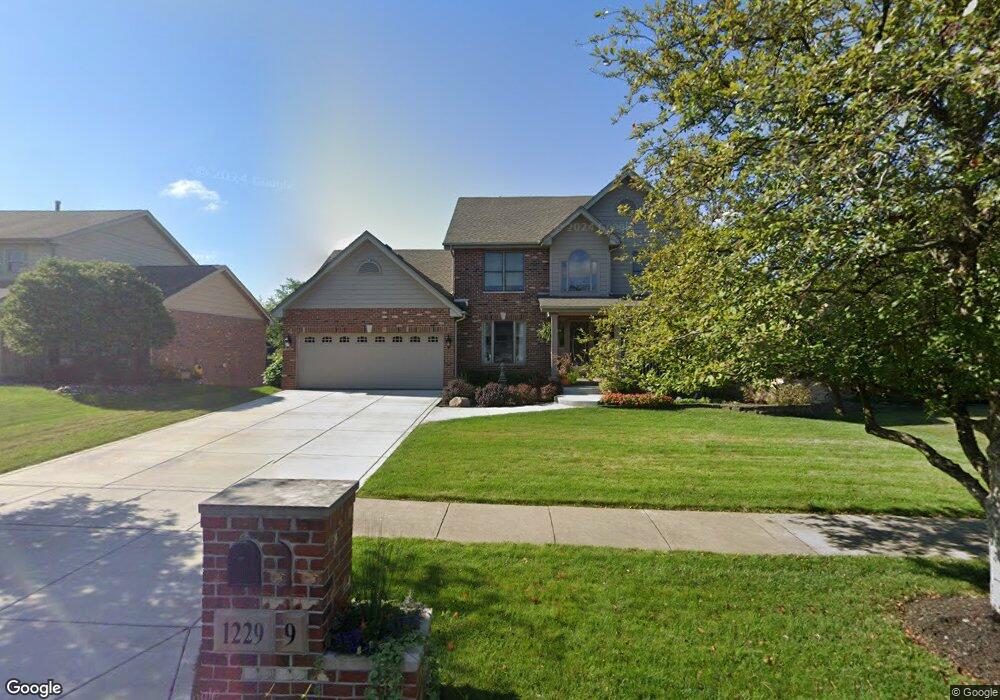
1229 St Charles Dr Lockport, IL 60441
Estimated Value: $458,675 - $562,000
Studio
--
Bath
--
Sq Ft
9,148
Sq Ft Lot Lot
About This Home
This home is located at 1229 St Charles Dr, Lockport, IL 60441 and is currently estimated at $510,169. 1229 St Charles Dr is a home located in Will County with nearby schools including Milne Grove Elementary School, Kelvin Grove Jr High School, and Lockport Township High School East.
Ownership History
Date
Name
Owned For
Owner Type
Purchase Details
Closed on
Aug 30, 2004
Sold by
Battista Theodore A and Battista Josephine D
Bought by
Panos James N and Panos Michelle
Current Estimated Value
Home Financials for this Owner
Home Financials are based on the most recent Mortgage that was taken out on this home.
Original Mortgage
$279,000
Outstanding Balance
$140,890
Interest Rate
6.17%
Mortgage Type
Purchase Money Mortgage
Estimated Equity
$369,279
Purchase Details
Closed on
Dec 9, 1999
Sold by
Oremus Laura
Bought by
Battista Theodore A and Battista Josephine D
Home Financials for this Owner
Home Financials are based on the most recent Mortgage that was taken out on this home.
Original Mortgage
$117,000
Interest Rate
7.87%
Purchase Details
Closed on
Mar 18, 1999
Sold by
First National Bank Of Joliet
Bought by
Oremus Laura
Create a Home Valuation Report for This Property
The Home Valuation Report is an in-depth analysis detailing your home's value as well as a comparison with similar homes in the area
Home Values in the Area
Average Home Value in this Area
Purchase History
We collect this data history from publicly available records. To have your information removed, we recommend requesting removal directly through your county’s website.
| Date | Buyer | Sale Price | Title Company |
|---|---|---|---|
| Panos James N | $349,000 | Chicago Title Insurance Co | |
| Battista Theodore A | $232,500 | Chicago Title Insurance Co | |
| Oremus Laura | $47,000 | -- |
Source: Public Records
Mortgage History
We collect this data history from publicly available records. To have your information removed, we recommend requesting removal directly through your county’s website.
| Date | Status | Borrower | Loan Amount |
|---|---|---|---|
| Open | Panos James N | $279,000 | |
| Previous Owner | Battista Theodore A | $117,000 |
Source: Public Records
Tax History
| Year | Tax Paid | Tax Assessment Tax Assessment Total Assessment is a certain percentage of the fair market value that is determined by local assessors to be the total taxable value of land and additions on the property. | Land | Improvement |
|---|---|---|---|---|
| 2024 | $14,022 | $164,324 | $32,683 | $131,641 |
| 2023 | $13,421 | $147,521 | $29,341 | $118,180 |
| 2022 | $12,241 | $138,970 | $27,640 | $111,330 |
| 2021 | $11,613 | $130,599 | $25,975 | $104,624 |
| 2020 | $11,325 | $126,305 | $25,121 | $101,184 |
| 2019 | $10,769 | $119,720 | $23,811 | $95,909 |
| 2018 | $11,033 | $119,720 | $23,811 | $95,909 |
| 2017 | $10,635 | $113,018 | $22,478 | $90,540 |
| 2016 | $10,186 | $105,922 | $21,067 | $84,855 |
| 2015 | $9,467 | $98,806 | $19,652 | $79,154 |
| 2014 | $9,467 | $94,101 | $18,716 | $75,385 |
| 2013 | $9,467 | $94,101 | $18,716 | $75,385 |
Source: Public Records
Map
Nearby Homes
- 1117 Michael St
- 1125 Darin Dr
- 1319 Highland Ave
- 16326 S Jannel Ct
- 1106 Maple Ct
- 812 S Farrell Rd
- 817 Summit Dr Unit 5A
- 1011 Maitland Dr
- 629 Thornton St
- 9.5 Acres S Archer Ave
- 1208 E North St
- 1002 Runyan Dr
- 1104 Basin Dr
- 1005 Valley Ln
- 16533 W Mckenzie Ave
- 16345 Deer Run Dr
- 1107 Valley Ln
- 1222 Cleveland St
- 1526 Peachtree Ln
- 520 S Jefferson St
- 1233 St Charles Dr
- 1233 Saint Charles Dr
- 1225 St Charles Dr
- 1234 Prodehl Dr
- 1230 Prodehl Dr
- 1237 St Charles Dr
- 1221 St Charles Dr
- 1228 St Charles Dr
- 1226 Prodehl Dr
- 1238 Prodehl Dr
- 1232 St Charles Dr
- 1224 St Charles Dr
- 1217 Saint Charles Dr
- 1241 Saint Charles Dr
- 1241 St Charles Dr
- 1236 St Charles Dr
- 1217 St Charles Dr
- 1220 St Charles Dr
- 1242 Prodehl Dr
- 1222 Prodehl Dr
Your Personal Tour Guide
Ask me questions while you tour the home.